

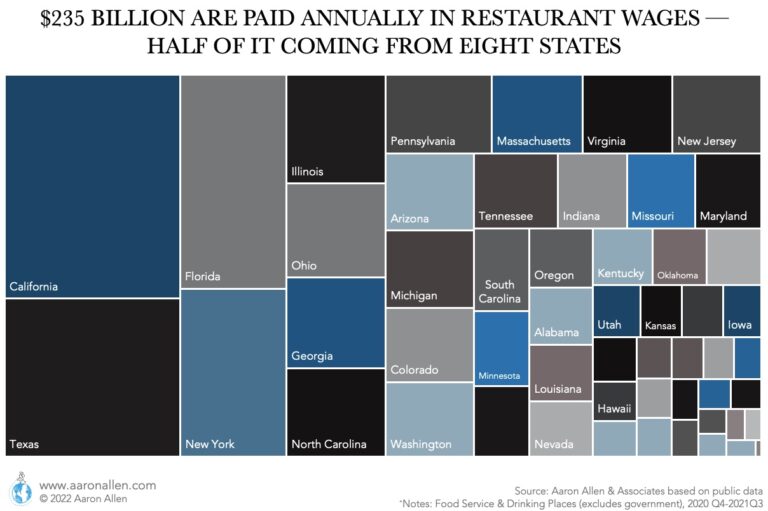
Restaurant labor costs are usually the largest cost foodservice establishments have in their P&L, averaging around 30% of sales.
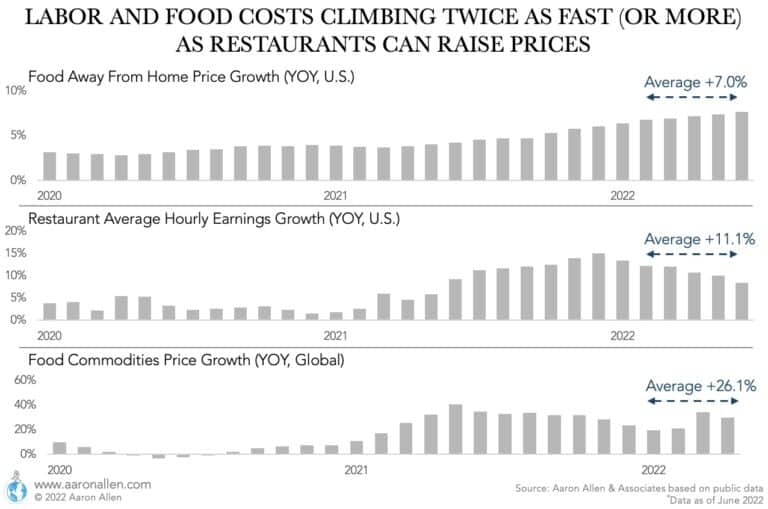
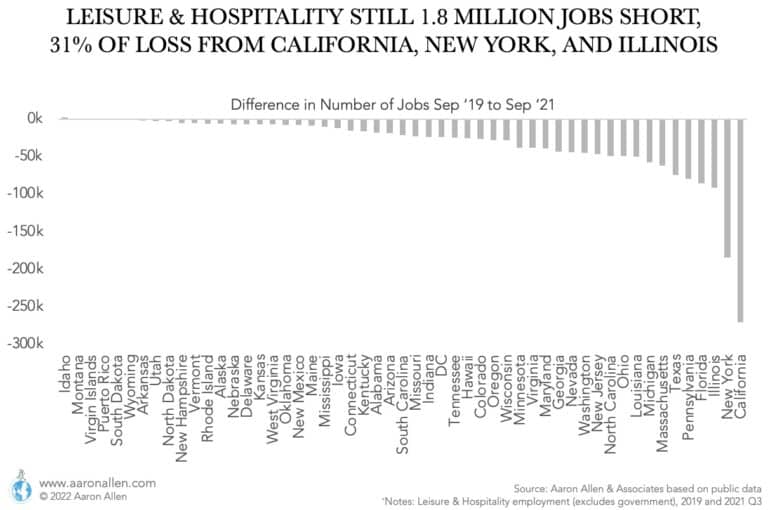
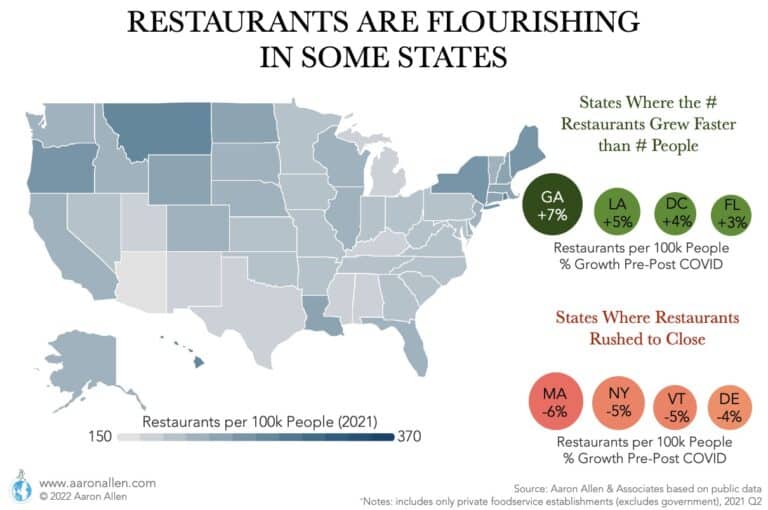
- In the U.S., there are around 11.7 million workers in the restaurant industry, and employment hasn’t fully recovered from the pandemic yet (as of mid 2022)
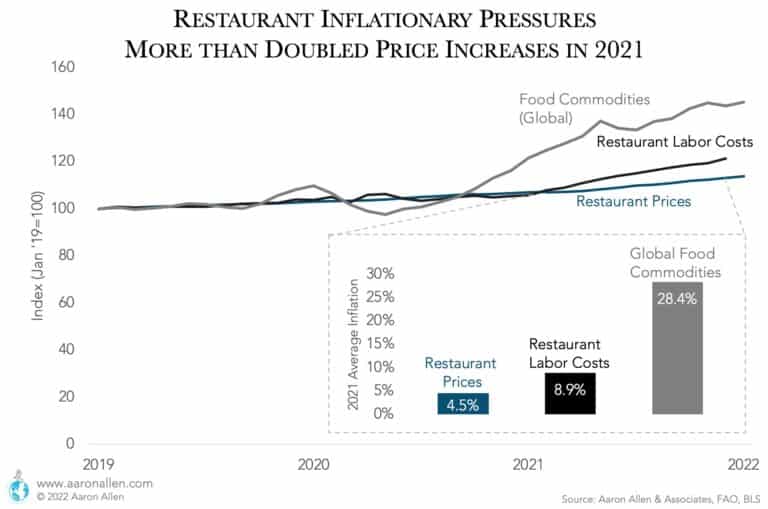
- Unemployment at restaurants is at historical lows, pushing hourly wages at historical heights and pressuring labor cost
- Restaurant workers make an average of $18.50 per hour (as of July 2022) — an increase in labor cost of 33% in the last five years
- Much of the restaurant employment is part time, with employees working an average 25.5 hours per week
- About 15.6 billion hours in work are going to the U.S. foodservice industry each year — and some portion of these tasks could be automated with robotics and other new restaurant technology
- With more than 677k restaurants in the U.S., the industry employs an average of 17 workers per establishment
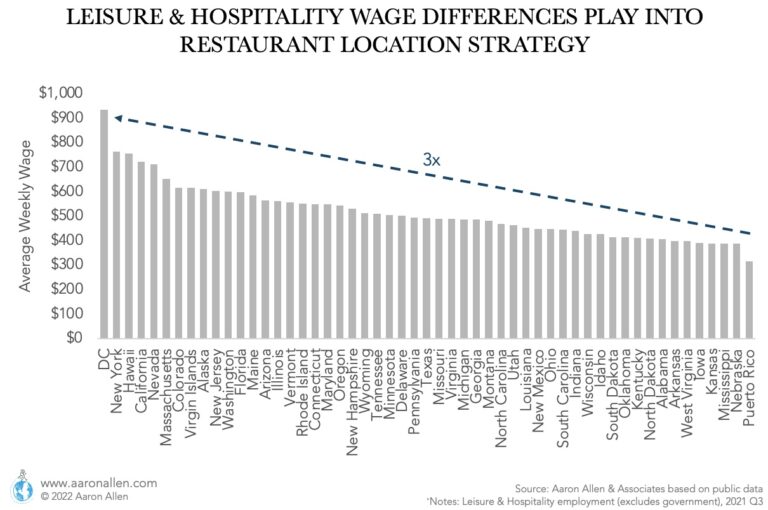
- Over the last decade, minimum wage increases have ranged from 0-90% depending on the state, increasing the cost of labor significantly
How to Optimize Restaurant Labor Cost
It’s clear that restaurant labor cost optimization will become critical to any business open today seeking to still be alive in five years. It’s not that managing labor is any more or less important than it was in the past, it’s that the sophistication required to manage and optimize it going forward will prove far more challenging. As survival-of-the-fittest instincts kick in for the strong to evolve or die, they will look for every competitive edge they claw into their toolkit, including killing off the weaker of their kind that didn’t prepare or avail themselves with the best offensive and defensive strategies.
If this all sounds like one of those futuristic game shows where friends compete for their lives until only one or a few are left standing, that is, sadly, sort of the case. Globally, we will soon reach the point where there are so many more people desiring to eat in restaurants than there are people willing to work in them for the wages offered, that for both factors of costs to operators and changing demands of consumers there will be a seismic shift in restaurant economic models, and new tools and tactics will be devised and deployed in the battle for a share of consumer stomachs.
Thinking through the following items will help to plan out a successful strategy to optimize restaurant labor costs.
1. Know Your Restaurant Labor Cost by Performing Capacity Analysis & Establishing Par Levels
The first step in any improvement initiative is to establish baselines and conduct a gap analysis of current performance to desired targets for the optimal restaurant labor cost and comparable industry or internal benchmarks. Some questions to ask when beginning to set the baselines include:
- What are sales per employee? Per labor hour?
- What are employee turnover and retention rates? At individual units? Company-wide?
- What are the current limits of capacity for each profit center within the restaurant? Each cost center?
- After performing this analysis, what correlations and patterns were evident after this analysis?
Putting this into practice, say for a drive-thru restaurant, one question would be what is the maximum number of vehicles that each restaurant can put through in an hour? If it’s a large system and some locations have double lines and multiple service windows but others do not, is this factored into the capacity analysis for each location, and then system-wide? Or is it just averaged across the company (as this could make a difference in the performance evaluation for each location)?
Sound overwhelming? Don’t worry, most restaurant chains don’t currently have this data at their fingertips at the moment, either. However, as labor costs rise, operators will be pushed to build intensely robust analytical capabilities to be able to see real-time performance metrics for every position and station in every restaurant in their system.
Yet, at present, most restaurants are still circulating weeks-old Excel files for manual data tabulation and analysis and backward-looking printed P&L statement, rather than finely tuned future-looking forecasts and predictive analytics tools.
2. Execute Station & Position Productivity Analysis to Reduce the Cost of Labor
After establishing maximum capacity and par levels, it’s time to conduct a gap analysis to see how station- and position-level data and performance stack up. Here are some methods to identify areas of opportunity for process improvements when looking to improve your restaurant labor cost:
- TASK ANALYSIS: There is no point making more efficient that which shouldn’t be done at all. To identify which processes are really necessary, performing a task analysis for each (or at least starting with the most common) process completed at a restaurant is the first step. Then, companies can begin to engineer completely new ways of addressing these tasks to allow for quantum leaps in performance and productivity.
- LABOR ANALYSIS: How many hours of time does as company buy each year (combining both salaried and hourly employees)? Is there any idea how much time is spent on doing what? If this labor data is collected and put into a pie chart, how would it look? Let’s assume a restaurant has 50 employees on an FTE (full-time equivalent) basis. Those 50 employees multiplied by 50 work weeks per year and 40 hours a week comes to 100,000 man-hours per year. Many companies do not know where all of that time is going, much less any additional granular-level detail (by position, department, and how to look by classification of task and activity). We’ve observed the individual, manual filling of thousands of soufflé cups with different sauces – up to 2,000 cups per day. Extrapolated out over the system, millions of cups were being filled by hand each year. The result was both a waste of activity and inconsistent product (as the cups were filled to varying levels). The fact that this task could be centralized, or even mechanized, could have eliminated hundreds of labor hours each year.
- TIME & MOTION STUDIES: Scientific management systems have been around since the 1950s, but time and motion studies are still as rare to the restaurant industry as they’ve ever been. While every guest and restaurateur knows that ticket times are important, even on this point most restaurant operators can’t quantify with certainty their ticket times, much less produce scientific insights into the sub-components of the processes that influence ticket times (from ordering through storage and production). What’s partially confounding is, while this is so rare, the conversation about labor optimization and increasing labor costs is being discussed every day. Discourse is more than complaining and conjecture, absent time and motion study by task, position and functional area, focused on the Pareto principle pursuing those highest cost categories in descending order.

3. Identify Tech-Enabled Labor Productivity Enhancements
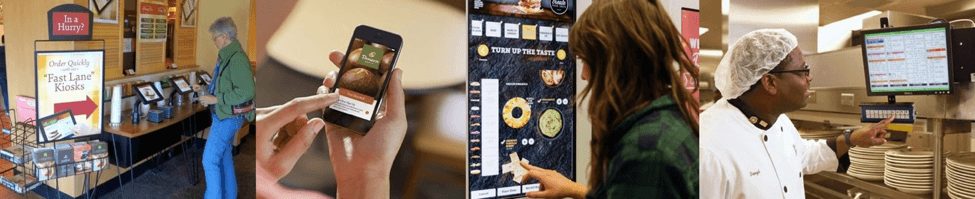
It’s is true: in order to reduce labor costs, most of the line-level staff in limited-service restaurants will be replaced by robots. Kiosks and other self-ordering technologies have already begun to replace hourly employees McDonald’s, Panera, and Wendy’s have all implemented some self-order tech in at least some of their stores to mitigate and offset the effects of wage inflation).
Predictive analytics technologies that help forecast customer traffic and even popular menu items by analyzing and aggregating historical data – everything from previous order trends to the weather and traffic patterns – will allow more accurately planning labor schedules, optimizing time on the clock, and reducing restaurant labor cost.
One consistent theme across all categories and geographies will be the pursuit and desire to shift and off-load aspects of service – particularly to the guest using self-ordering in a manner that customers do not feel put off by, but rather attracted to and appreciative of. When seeking means of improving labor costs, first identify opportunities for the reduction of repetitive tasks, then determine ways to eliminate or automate those tasks.


Ultimately, screen sizes will be chased down from digital boards, to kiosks, to tablets, to individual mobile devices, until screens themselves disappear and re-emerge in the form of artificial intelligence using predictive analytics to anticipate customer orders and preferences. All of these technologies are related to the guest, though equal – yet less obvious – efficiency enhancements and gains will come from other uses that will allow employees, franchisees and other key stakeholders to serve themselves on otherwise administratively burdensome activities and repetitive tasks.
For years there’s been discussion of the growth of “the cloud” and its role in the future. For restaurants, this goes far beyond just cloud-based POS systems. It will enable other on-demand self-serve and real-time tools and technologies. Managers invest time in penciling out an Excel spreadsheet schedule that’s inevitably scratched over as employees trade shifts – an administrative time-suck that plays out next to the manager’s office in restaurants all over the world with everyone thinking “there has to be an easier way.”
With new labor-management modules and applications that have been created to address these problems, employees can now trade schedules electronically with an automated manager approval process with permissions and restrictions set as parameters providing control without being controlling. This is only one example, and this theme can be applied across much broader applications, which could result in percentage points of reduction in inefficient use of time. This multiplied across a system with tens or hundreds of thousands of employees will tilt the balance of power in favor of early adopters.
4. Foster Associate Engagement
There has probably never been a discussion on the subject of labor productivity and restaurant labor costs that didn’t also address the critically important consideration of Associate Engagement; and we won’t break with that important tradition here.
As cliché as it may sound to anyone looking for clever new tricks for labor productivity improvements, any productivity initiative that doesn’t put winning the hearts and minds of employees at the top of the list of issues to address is doomed from the start.
Communicating (early and often) about the changes that will be upcoming for employees is a crucial step before implementing the productivity initiatives. In fact, Associate Engagement can even be improved during times of change if employees are provided with tools to provide their feedback to the changes being made, and their opinions are heard and taken into account.

5. Company Culture & Career Progression Have a Key Role in Employee Productivity
Company culture is something that needs to be actively lived in an organization, not just a mission statement and mantra that rests in a dusty three-ring binder on a shelf in the back office. Having this set of values, “norms,” and beliefs developed and truly integrated into the company is something many companies (mistakenly) believe is an unnecessary expense, rather than an investment that pays returns in the long term.
In addition to developing a company culture, having a clear progression plan for employees will create a sense of “gamification” among employees. Yes, that’s a real word that means applying the same premises of games (like scoring points, competition with others, and “winning”) to non-game activities. And who doesn’t want work to feel more like a game, so employees are motivated to keep besting their own (and their coworkers’) scores?
When considering a career progression program, companies should consider what it takes for employees to get to the next level within the organization. Is it clear what needs to happen to get to the next position for every position that’s currently held? And are there quantifiable targets with unbiased scoring criteria and clear progress metrics that will make it feel like employees are playing a fun game while working hard and get ahead within a company?
6. Implement Management by Objectives & Meritocracy
Management by objectives (MBO) is a philosophy developed in the 1950s. While it’s still taught in business schools and widely and generally understood, it’s rarely implemented (or at least implemented effectively). MBO enables the creation of a meritocracy within an organization, and the best contributors (regardless of seniority or position) are able to elevate themselves and, likewise, the business through meaningful and tangible contributions which are quantifiable in nature (as “do your best” objectives are as good as no goals at all).
While time-consuming and often requiring dedicated internal and external resources to administer and manage such a program effectively, companies that use an MBO system to set goals quarterly generate 31% greater returns from their performance process than those who set goals annually.
We’ve seen this program, implemented effectively, have a transformative effect on client operations. For instance, we adapted the MBO philosophy and approach, combining restaurant-specific performance metrics and operational understanding with modernized tools for tracking, measurement and reporting and were able to improve unit revenue growth in every case by 20% or more – in some cases doubling revenue growth out of existing locations while simultaneously improving on important productivity metrics (sales per employee, sales per labor hour, etc.) and profitability.
It’s more than just the “if you can’t measure it, you can’t manage it” mantra. It’s also the dramatic and positive impact on employee morale which increases productivity and reduces restaurant labor cost.
7. Perform Organizational (Re)Design
Organizational design – or identifying elements of workflows or systems that provide opportunities for improvement – enables companies to focus efforts on maximizing both human processes and technological advances.
Companies should ask themselves if they would still structure their organizational chart the way it is now if they could do it all over again. Even universities have had to reshuffle their degree programs at an accelerating rate – as, for many, by the time a student graduates from a four-year program, half of what they have learned is outdated (or even obsoleted) by new technologies and discoveries.
Applying this methodology to restaurants (which have historically lagged behind the times in terms of adopting technological advancements) may lead to the realization that the organizational chart needs to be dramatically reworked and this will help labor cost.
Frequently Asked Questions
How much do servers cost?
Restaurant workers in the U.S. make an average $18.50 per hour. Production and non-supervisory employees earn an average $16.80 per hour and waiters and waitresses are around $15 per hour.
What is the average labor cost of a restaurant?
The average labor cost of a restaurant is around 30% of sales. Full-service restaurants are on the higher end, with average labor costs of 34% of sales, and limited-service restaurants are closer to 29%.
How do restaurants calculate labor costs?
The most common KPI for labor cost is wages as a percent of sales. This includes direct employment in the restaurant’s four walls, and usually excludes indirect jobs (assigned to SG&A) for administrative costs and personnel at the parent company.
Insights on Restaurant Labor Costs


Previous
Next
About Aaron Allen & Associates
Aaron Allen & Associates works alongside senior executives of the world’s leading foodservice and hospitality companies to help them solve their most complex challenges and achieve their most ambitious aims, specializing in brand strategy, turnarounds, commercial due diligence and value enhancement for leading hospitality companies and private equity firms.
Our clients span six continents and 100+ countries, collectively posting more than $300b in revenue. Across 2,000+ engagements, we’ve worked in nearly every geography, category, cuisine, segment, operating model, ownership type, and phase of the business life cycle.