Restaurant Industry

With as fast as the consumer, competition, technology, and disruptive forces are moving and influencing the $3.5 trillion restaurant industry, executive teams are wise to bring in quantitative data and objective analysis about what is happening both inside and outside the business. We deliver rich insights and industry intelligence to help inform corporate decision-making and strategy.

We’re tracking restaurant trends across the industry and the important dynamics emerging to shape up consumer behaviors and the competitive landscape across geographies globally — from Canadian restaurants to the Middle East, the restaurant industry in India and beyond — and across categories of the industry, from QSR and burgers to pizza to steakhouses and casual dining; from European fast-food chains to coffee in the UAE (and so much more).

Our insights provide with the corporate intelligence, investment ideas, and performance optimization strategies so that foodservice CEOs are not only better briefed of what to expect in 2020, but also better prepared to leapfrog the competition and make razor-sharp strategic capital allocations.

While the global foodservice industry is relatively predictable in terms of growth (it mirrors that of population, inflation, and driven by share of discretionary spend) there have been major shifts in where consumer dollars are being spent and where the smart money is headed:

  • With food startups, alternative formats, changes in appetites (such as the rise of vegetarianism and increased coffee consumption), it’s clear that consumer preferences are impacting restaurants and the broader spectrum of foodservice. The consumer, chain operators, suppliers, and investors are all seeing it unfold and seeking out the best sources of insights for what’s next and advisors who can help connect the dots.
  • While margins are shrinking across many geographies, many executive teams are busy triaging the wider onslaught of important issues keeping them awake at night. It’s not just the new disruptive forces bearing down on their organizations, it’s the increasing complexity of industry and business demands their organizations have been dealing with for decades.
  • Chains are growing through acquisitions. Private equity firms started gobbling up casual dining chains in 2017 and haven’t let up since. And more restaurant chains have gone private than public in recent years.
  • Delivery aggregators are growing much faster than restaurants. Third-party delivery providers — like Grubhub, Just Eat, Delivery Hero, and Takeaway — are experiencing revenue growth of at least 4x the pace of restaurants (considering public companies). For as much as we forecasted where delivery would be today (years ago), the next few years will further accelerate the widening performance gap between the haves and the have nots — those who are looking to and investing in the future compared to those clinging stubbornly to the past.
  • In many markets, labor costs are increasing faster than restaurants are able to increase prices (at least up to the COVID-19 pandemic). Many restaurant businesses are experiencing shrinking margins, sagging sales, sleepy stores, stronger competition, more fickle consumer expectations, disruptive forces, and mega-chains that are “building moats” around what was already nearly an impenetrable fortress.
  • Sometimes, the industry restaurant operators have to remind themselves they belong to an industry centered on the tenants and virtues of empathy, service-oriented intuition, and a more compassionate perspective than most other retailers are expected to embody or aspire to. As we often remind ourselves here, the business fundamentals of financial models and commercial feasibility must be there, but it’s the food + service industry – it’s really business + heaping helping of hospitality.

In the face of technology advancements, modernization, automation, delivery, expansion, remodels, retrofits, new alternative formats, potential acquisitions, many restaurant businesses are finding themselves in the spot of having to ask the big questions.

What is shaping up in terms of consumer trends, evolving dining behavior and consumption patterns, categories, segments, competitive dynamics, and macroeconomic conditions that may be relevant to our forecasts and future strategy? What should we acquire, create, grow, reformulate, or divest?

What’s starting now will shape consumer foodservice over the next decade in a rather significant fashion. That means this is a good time to modernize your restaurant and consumer foodservice industry investment thesis.

U.S. Restaurant Industry Insights

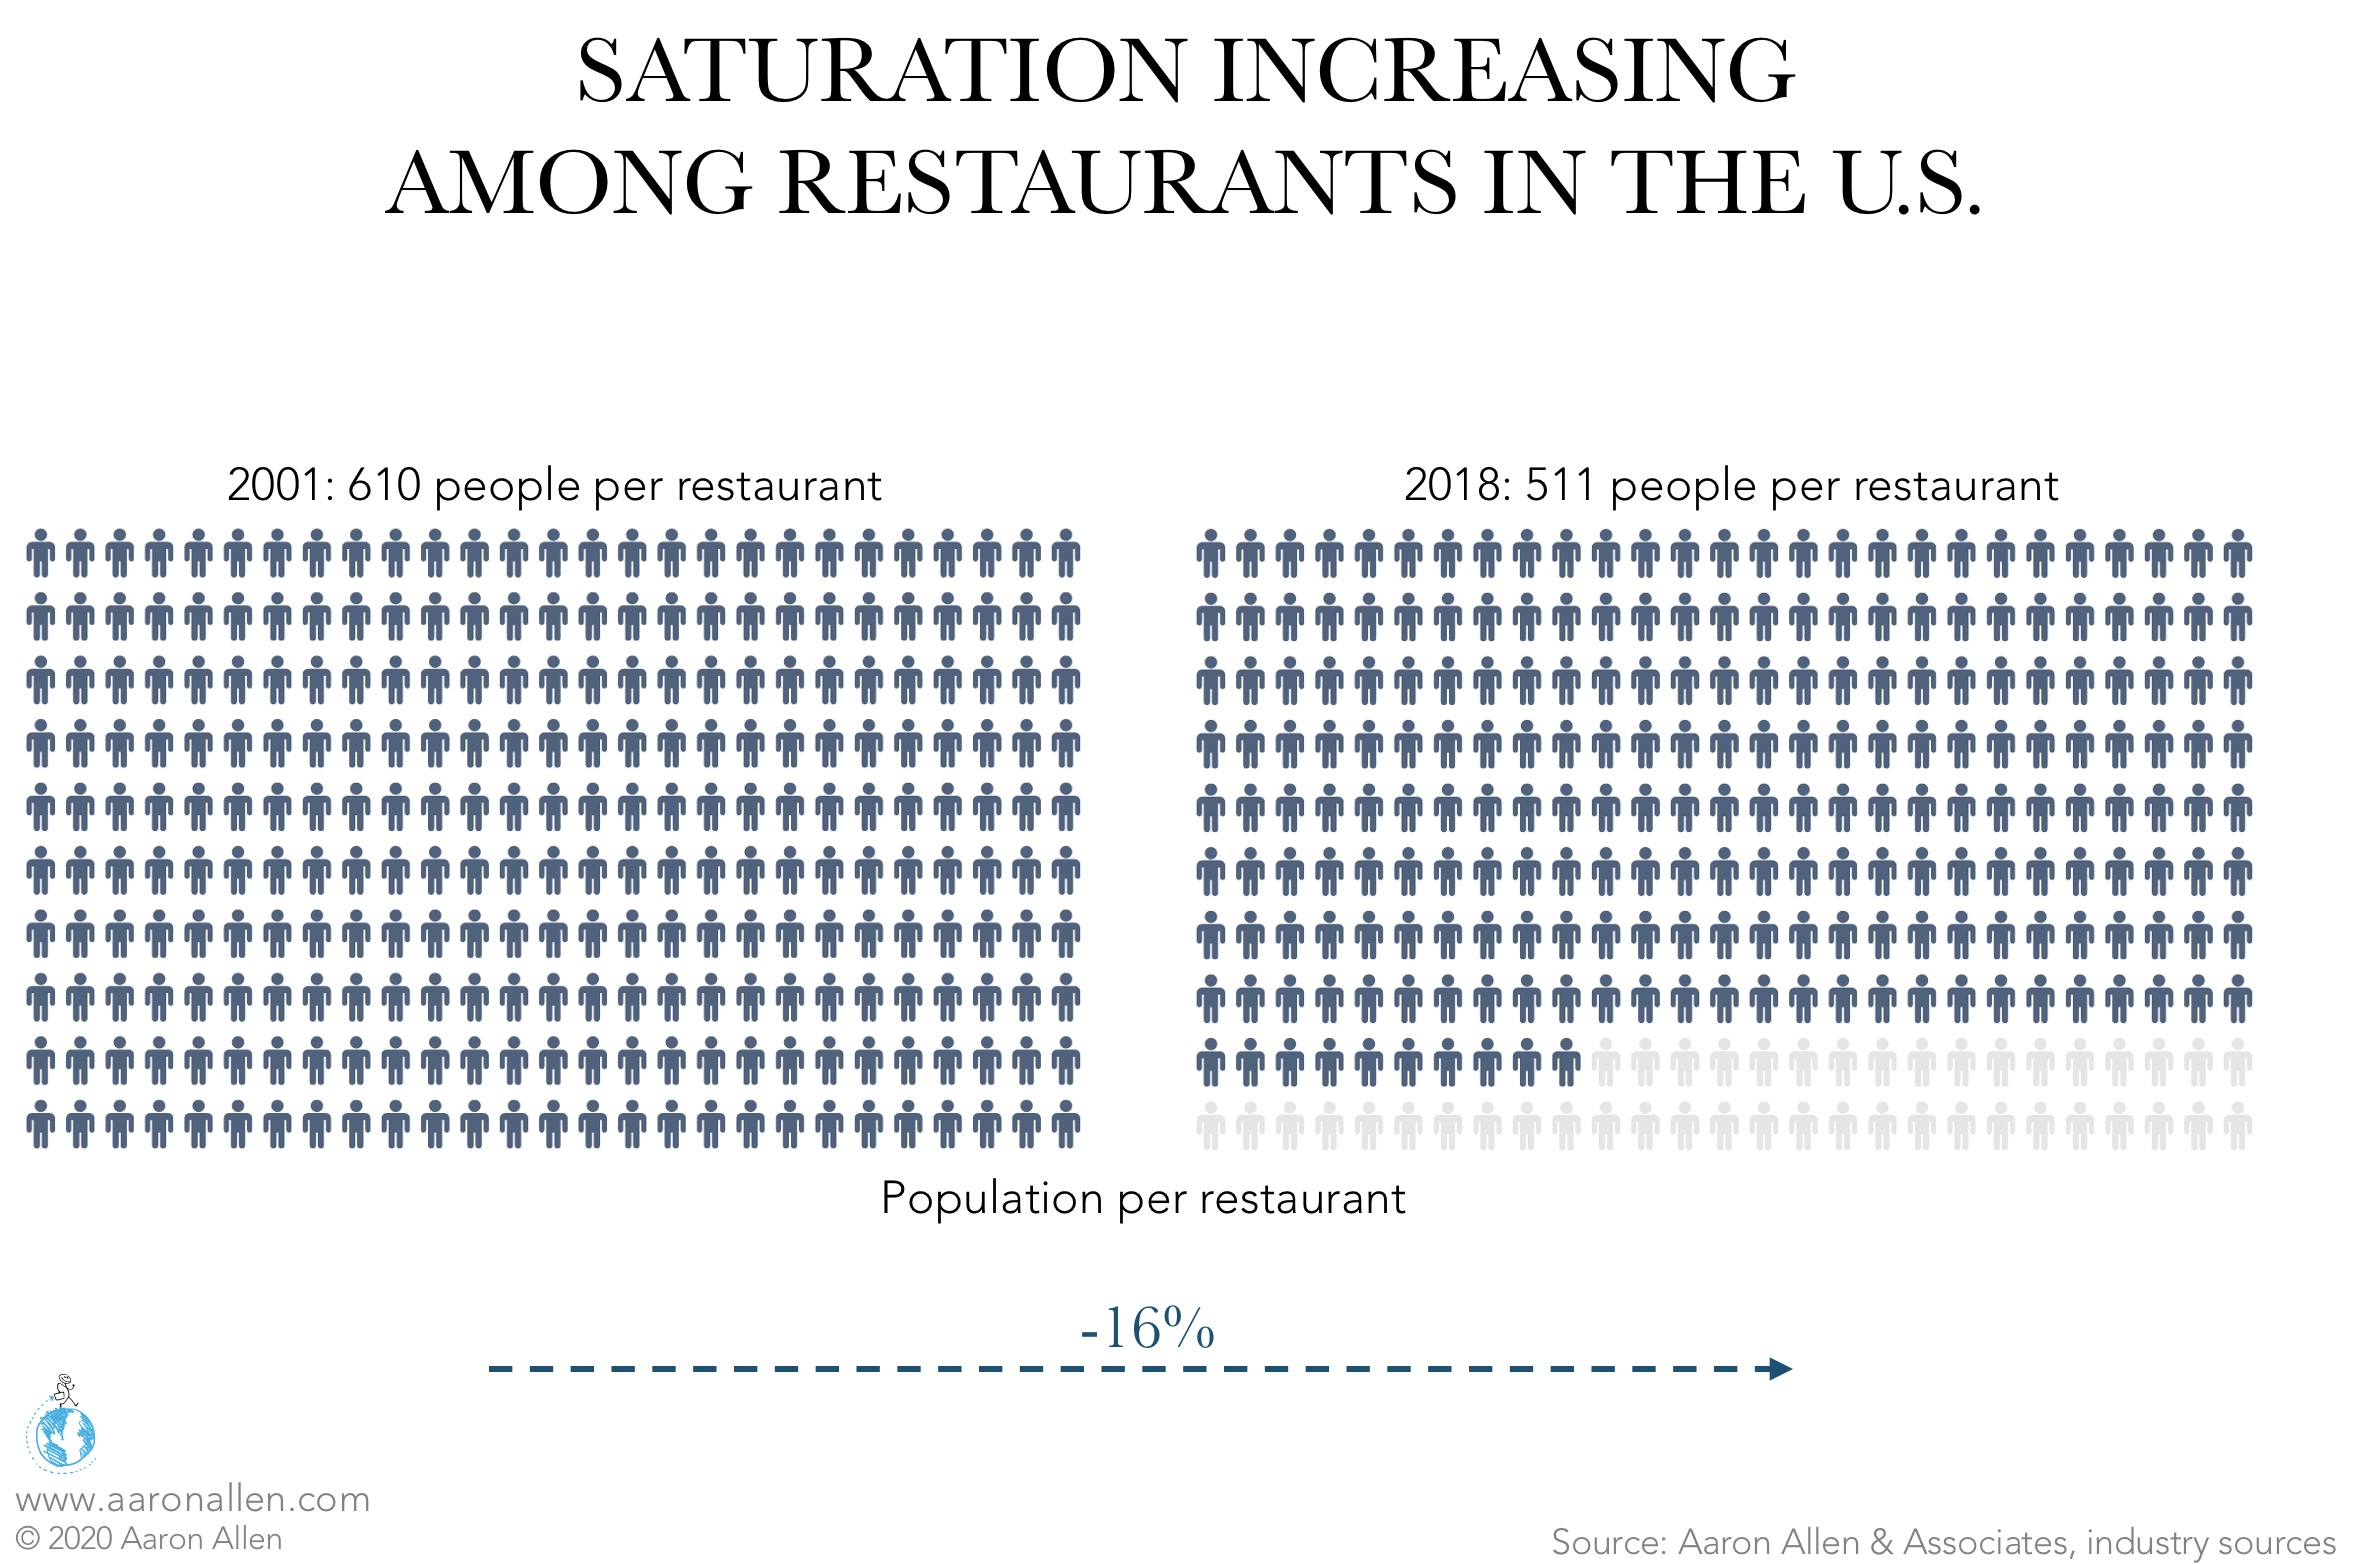
In many mature markets, the industry has reached a point of saturation such that any one company’s growth is coming at the expense of another. The number of restaurants in the U.S. is estimated at 652.8k as of 2019. Saturation has increased in the last years: the number of people per restaurant decreased by 16% from 2001-2018 (or, in other words, the number of establishments grew at rate 150% faster than the population). Saturation signals the onset of consolidation, and many of our clients are looking not just to get better but to get far ahead. Leaders are waking up to the realization that those who are not growing fast are dying slowly. Strong castles are built before the invaders arrive — and fortifying castles for the future means commissioning reinforcements today.

How many restaurants are there in the united states

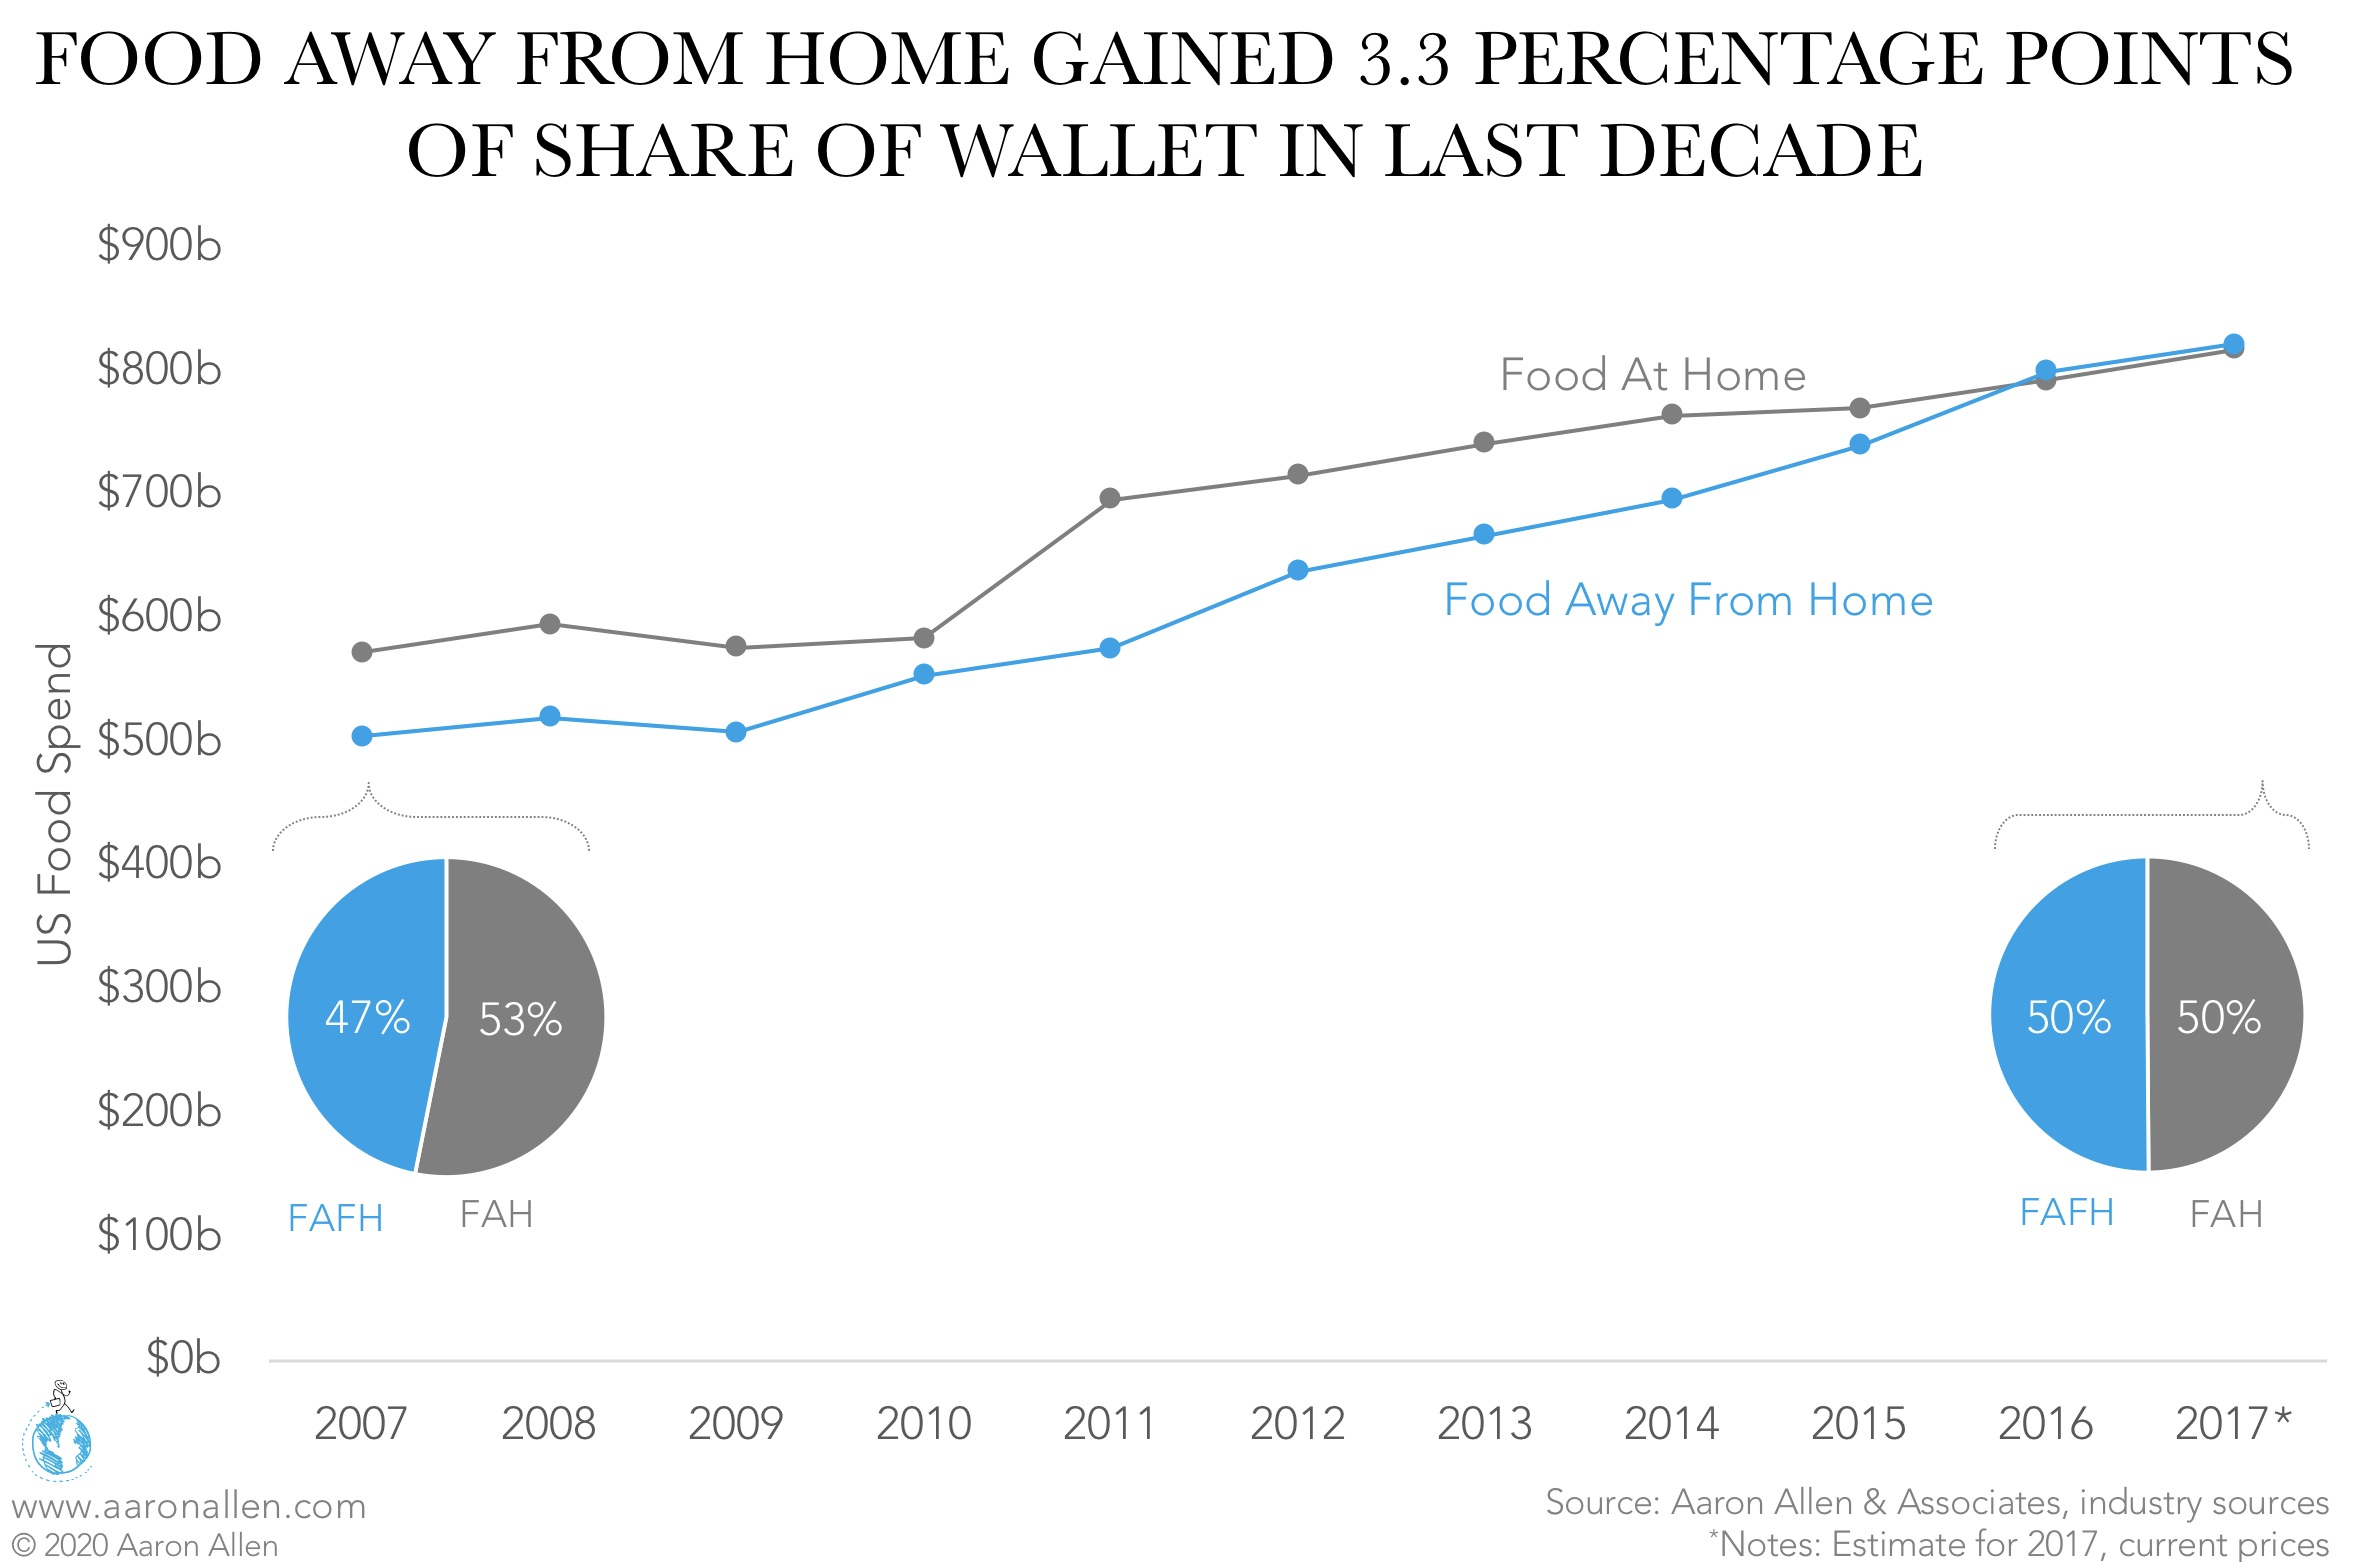
Food spend in the U.S. is estimated to have totaled $1.6t last year. Americans split their budgets almost equally between groceries (Food At Home) and restaurants (Food Away From Home). This was not always the case: the share for Food Away From Home has increased by 3.3 percentage points in the decade since 2007, gaining about $53.6m in business from Food At Home.

Restaurant Industry vs. Groceries Spend

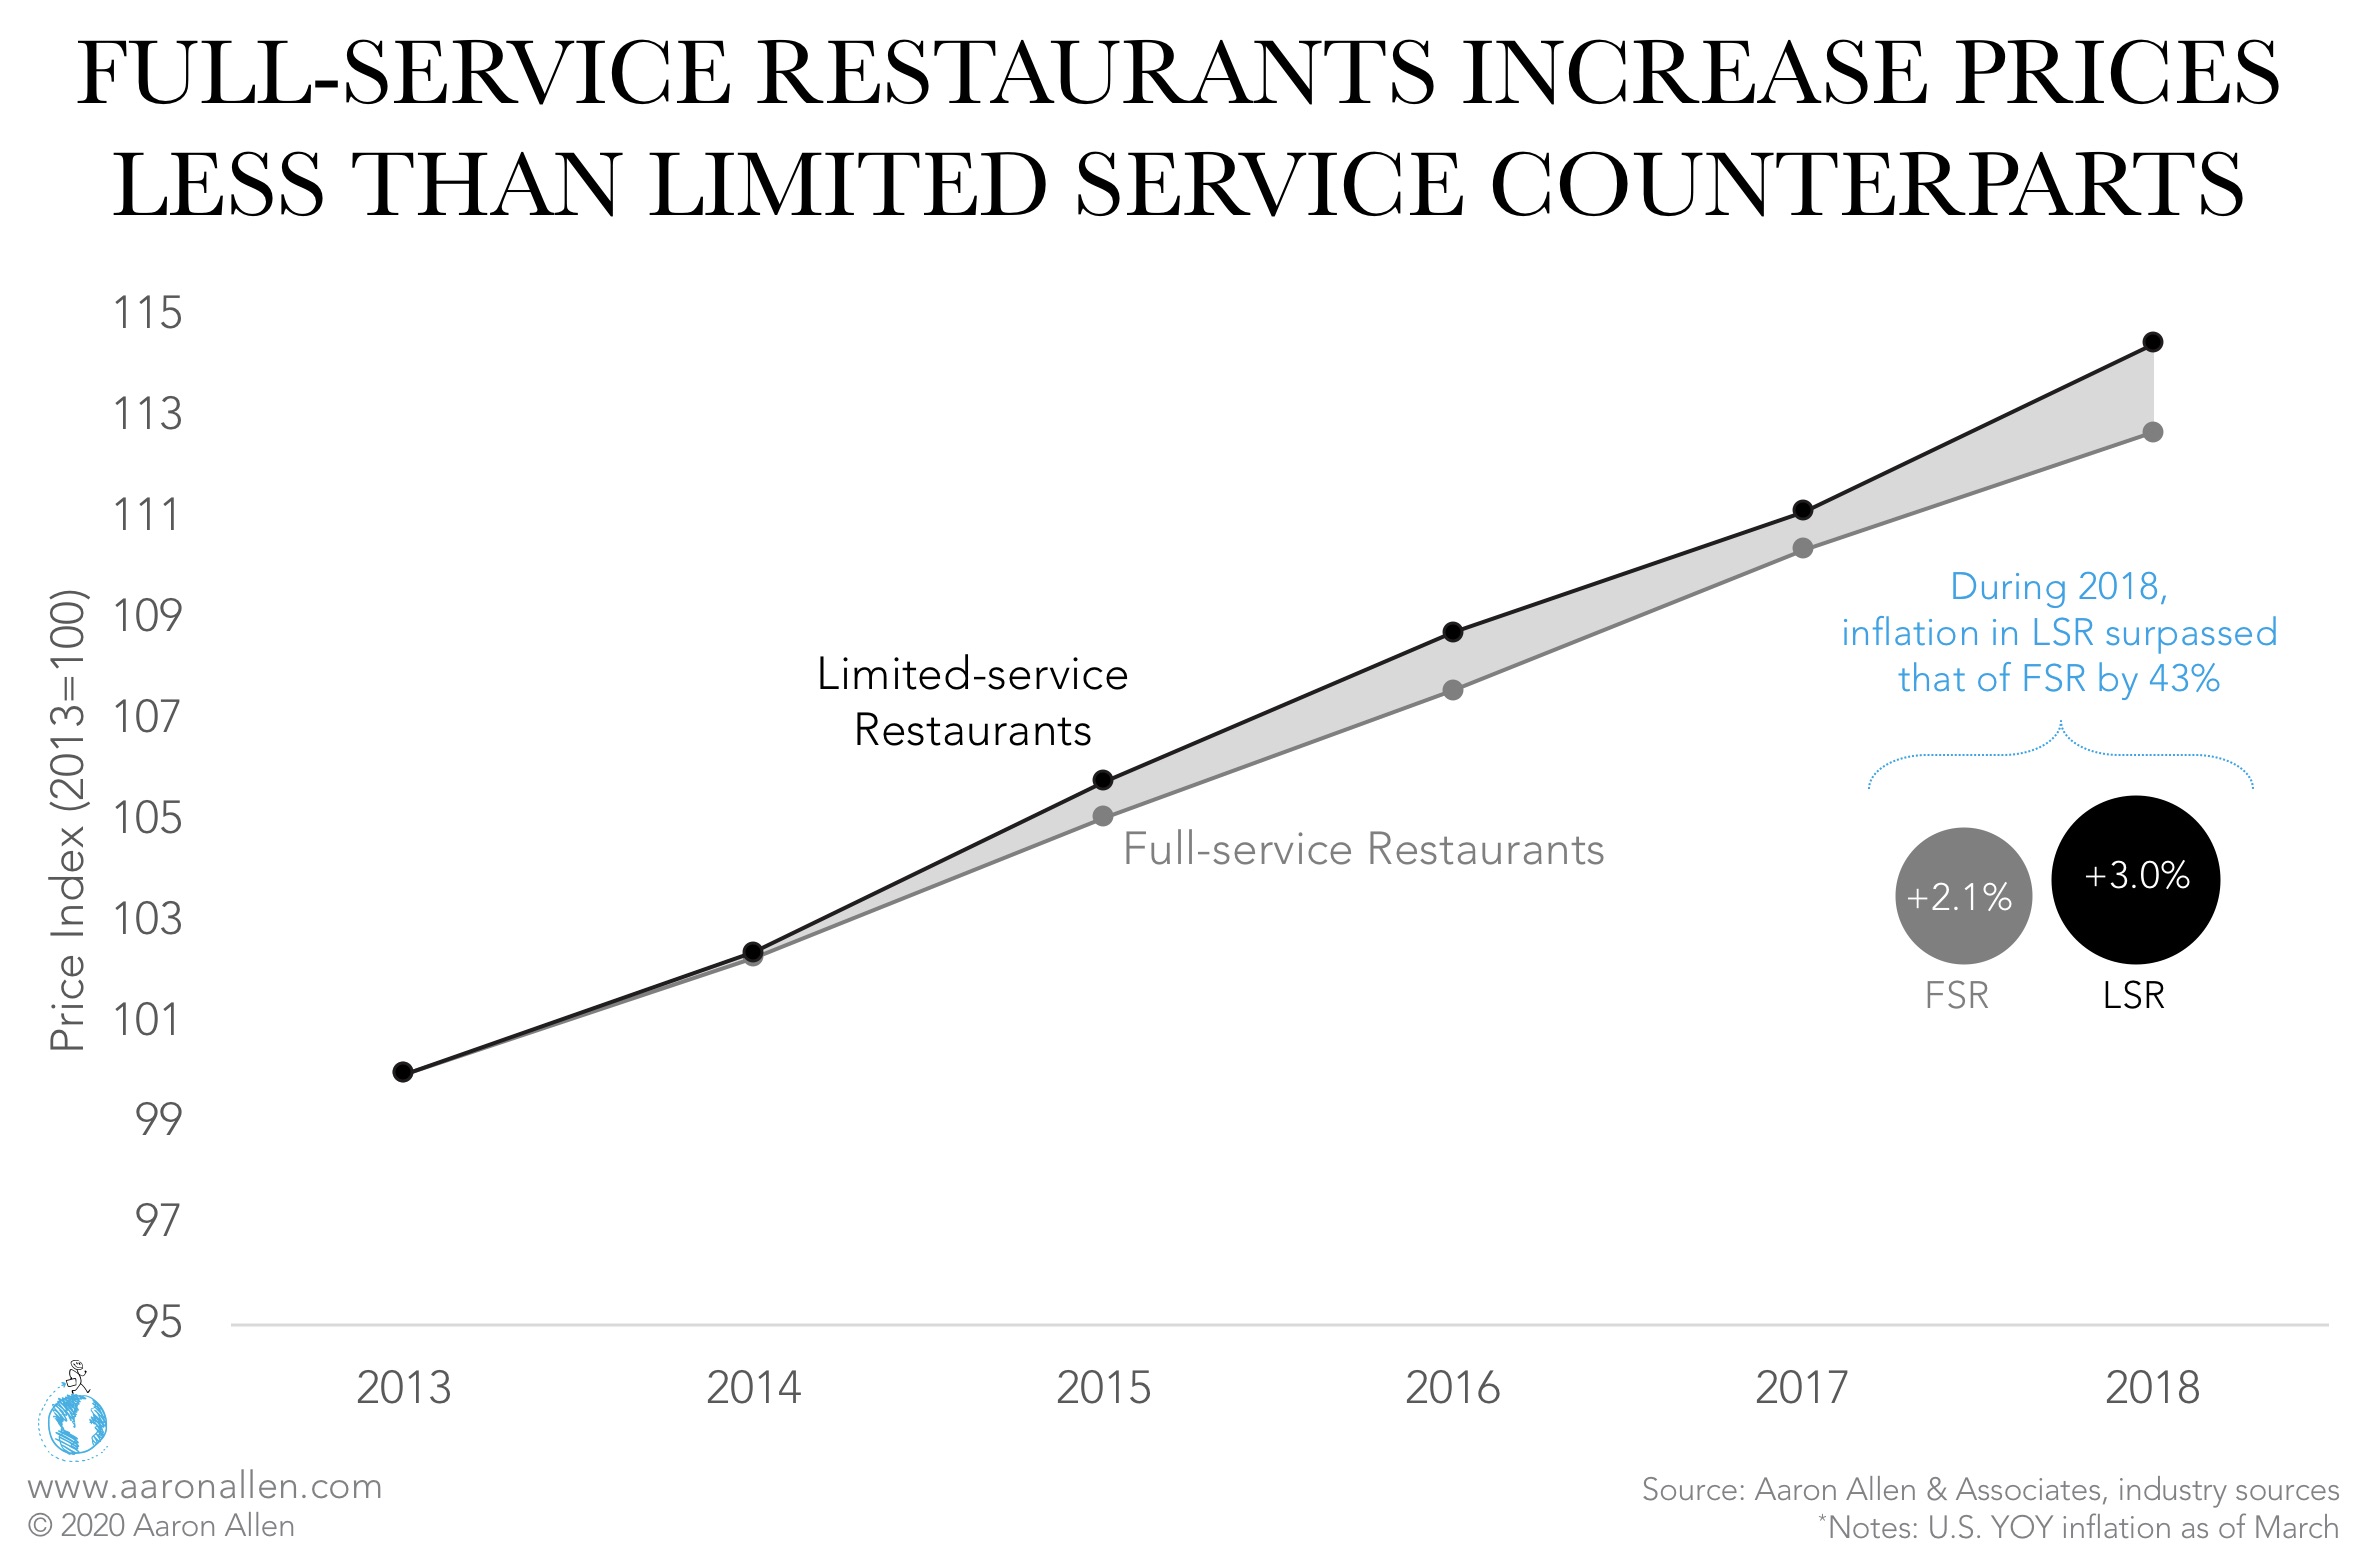
With consumers favoring faster foodservice options, full-service restaurants have been wary to raise prices — in fact, many of the major chains, especially in casual dining, have been offering deep discounts over the last few years. In four of the last five years, inflation for limited-service restaurants has been higher than that of full-service restaurants, and, in the past year (as of March 2018), inflation in LSRs surpassed that of FSRs by 43%.

QSR and Casual Dining Restaurant Inflation

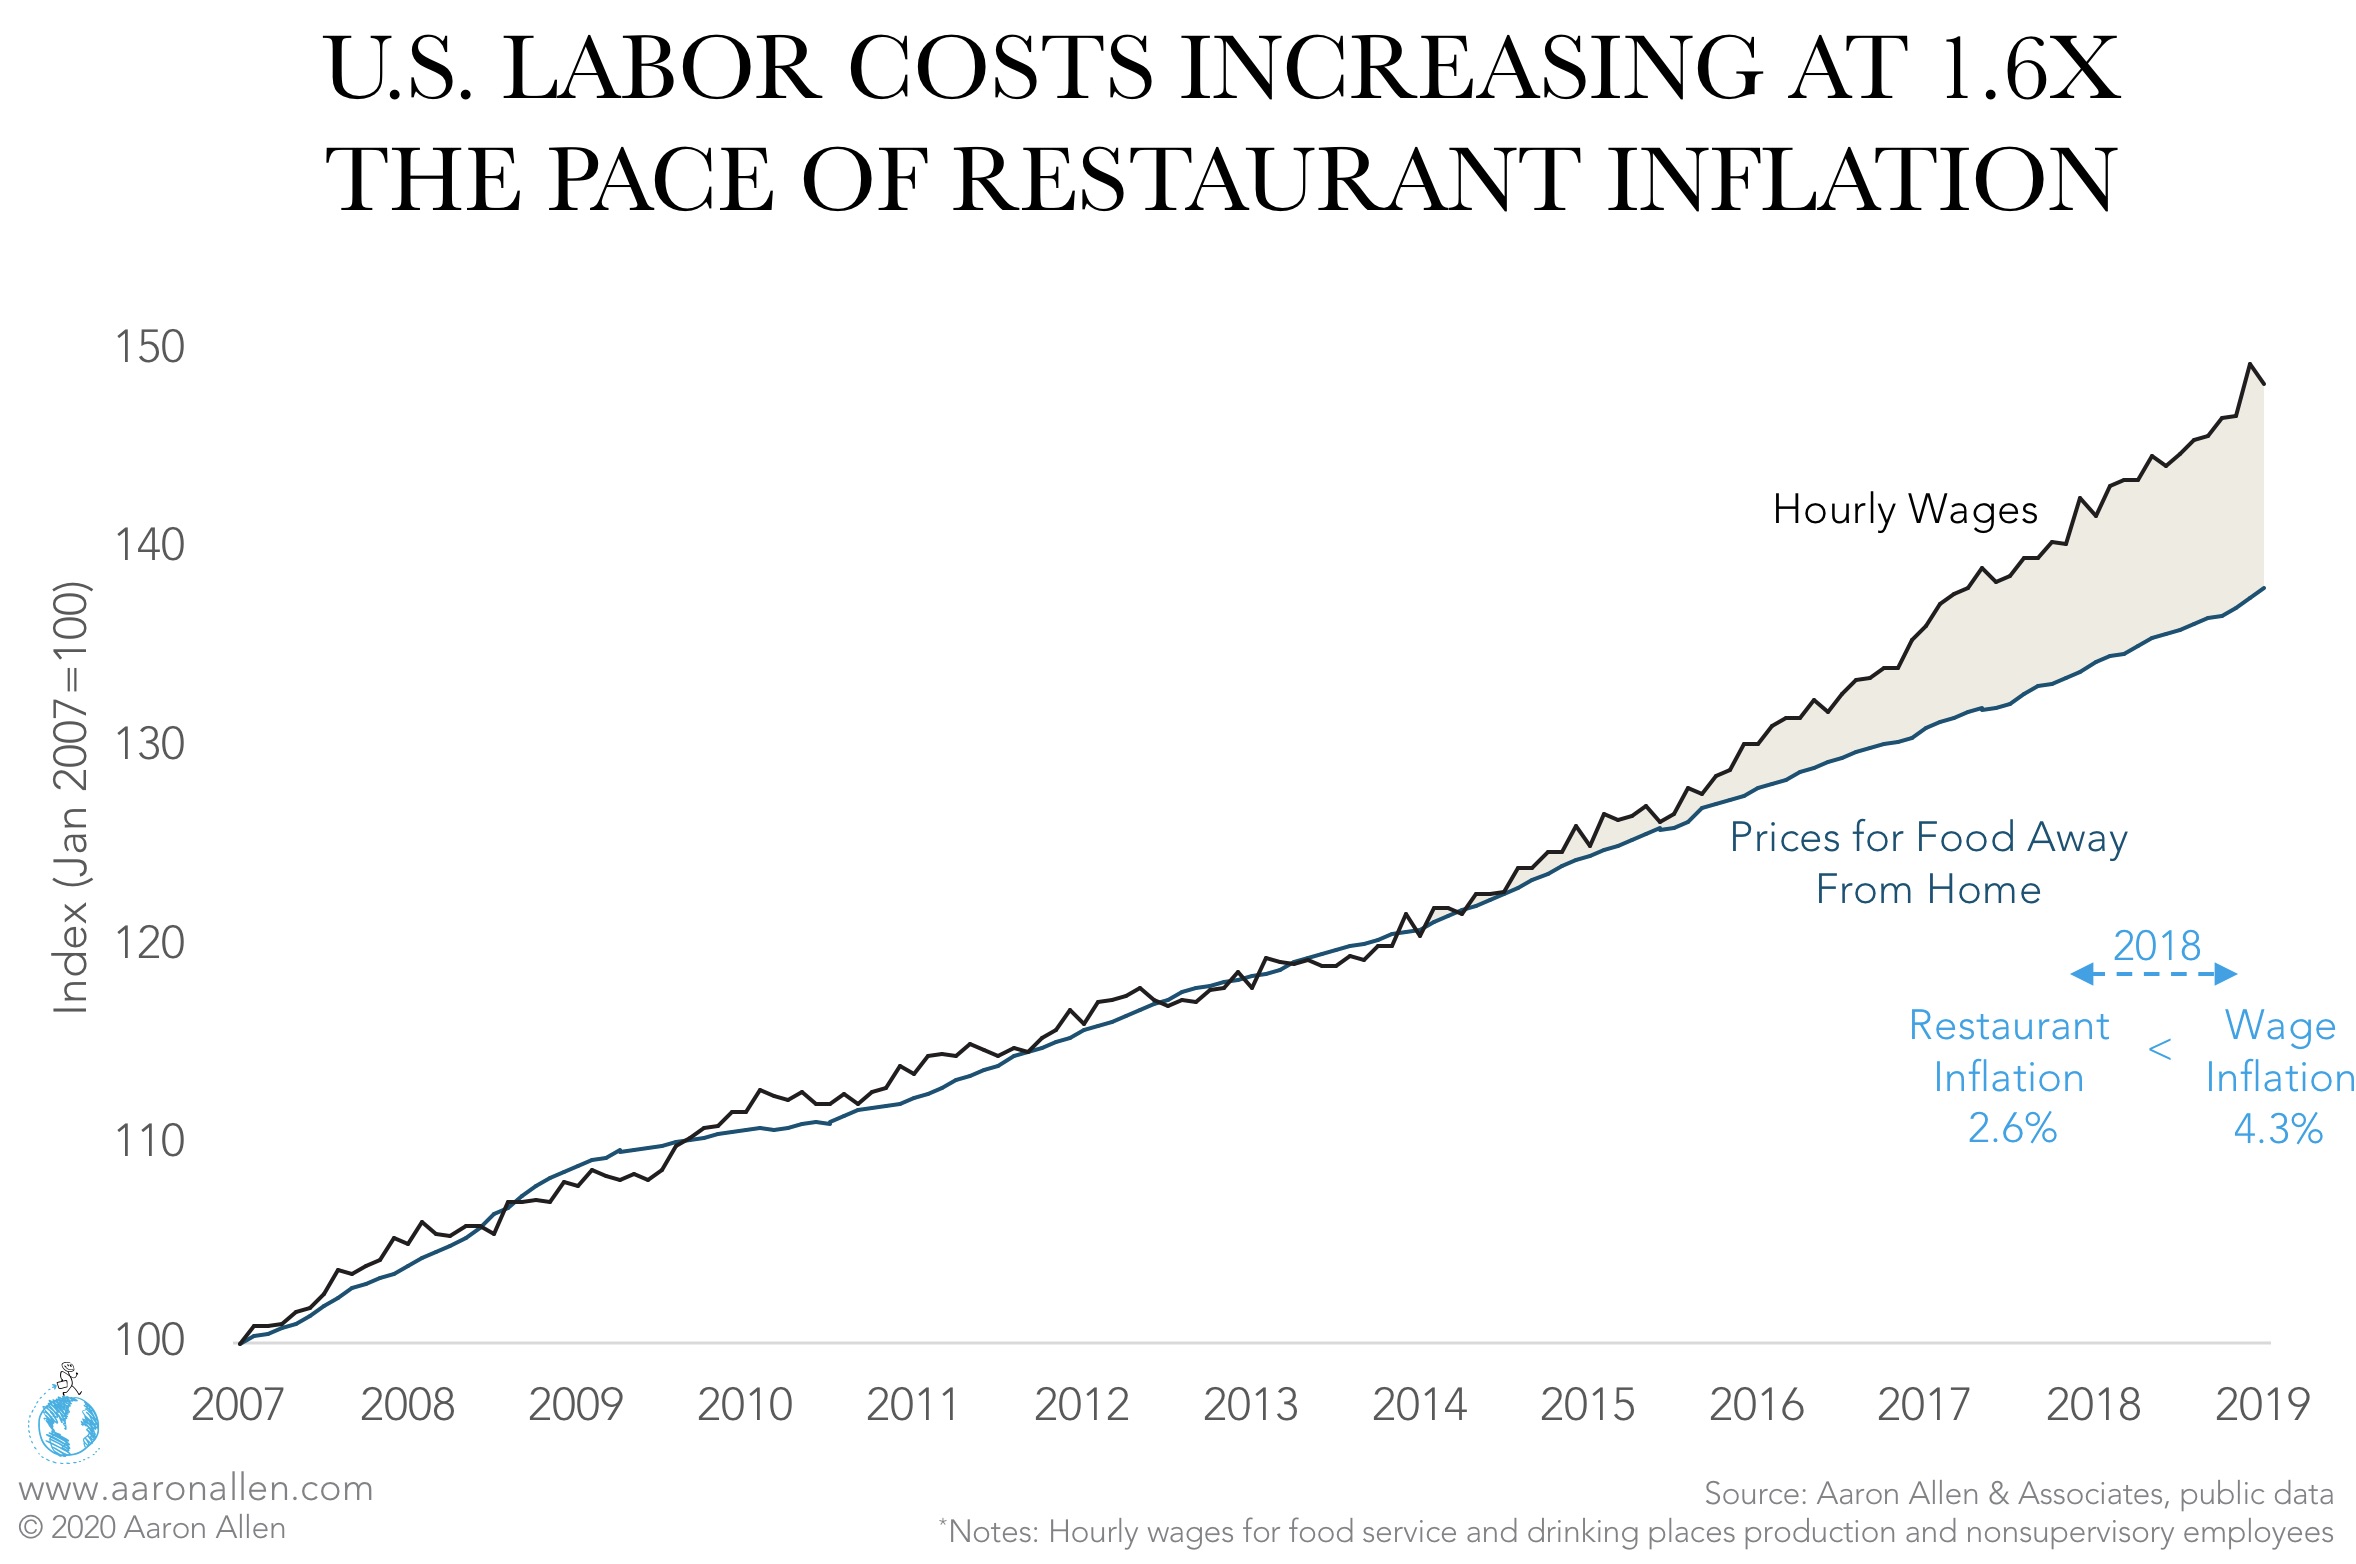
In many markets, labor costs are increasing faster than restaurants are able to increase prices. While hourly wages reached average inflation of 4.3% during 2018 in the U.S., restaurant inflation was 2.6%. Many restaurant groups have been unable to grow same-store sales at a pace faster than inflation. Sagging sales and falling thin margins urges investment in new tools and fresh thinking —but for many it feels like a bold decision that is riskier than kicking the can to next quarter or budget meeting; waiting for the board to push the agenda versus building the case for leapfrog investments. Waiting may hurt less, but it costs a lot more in the long run. 

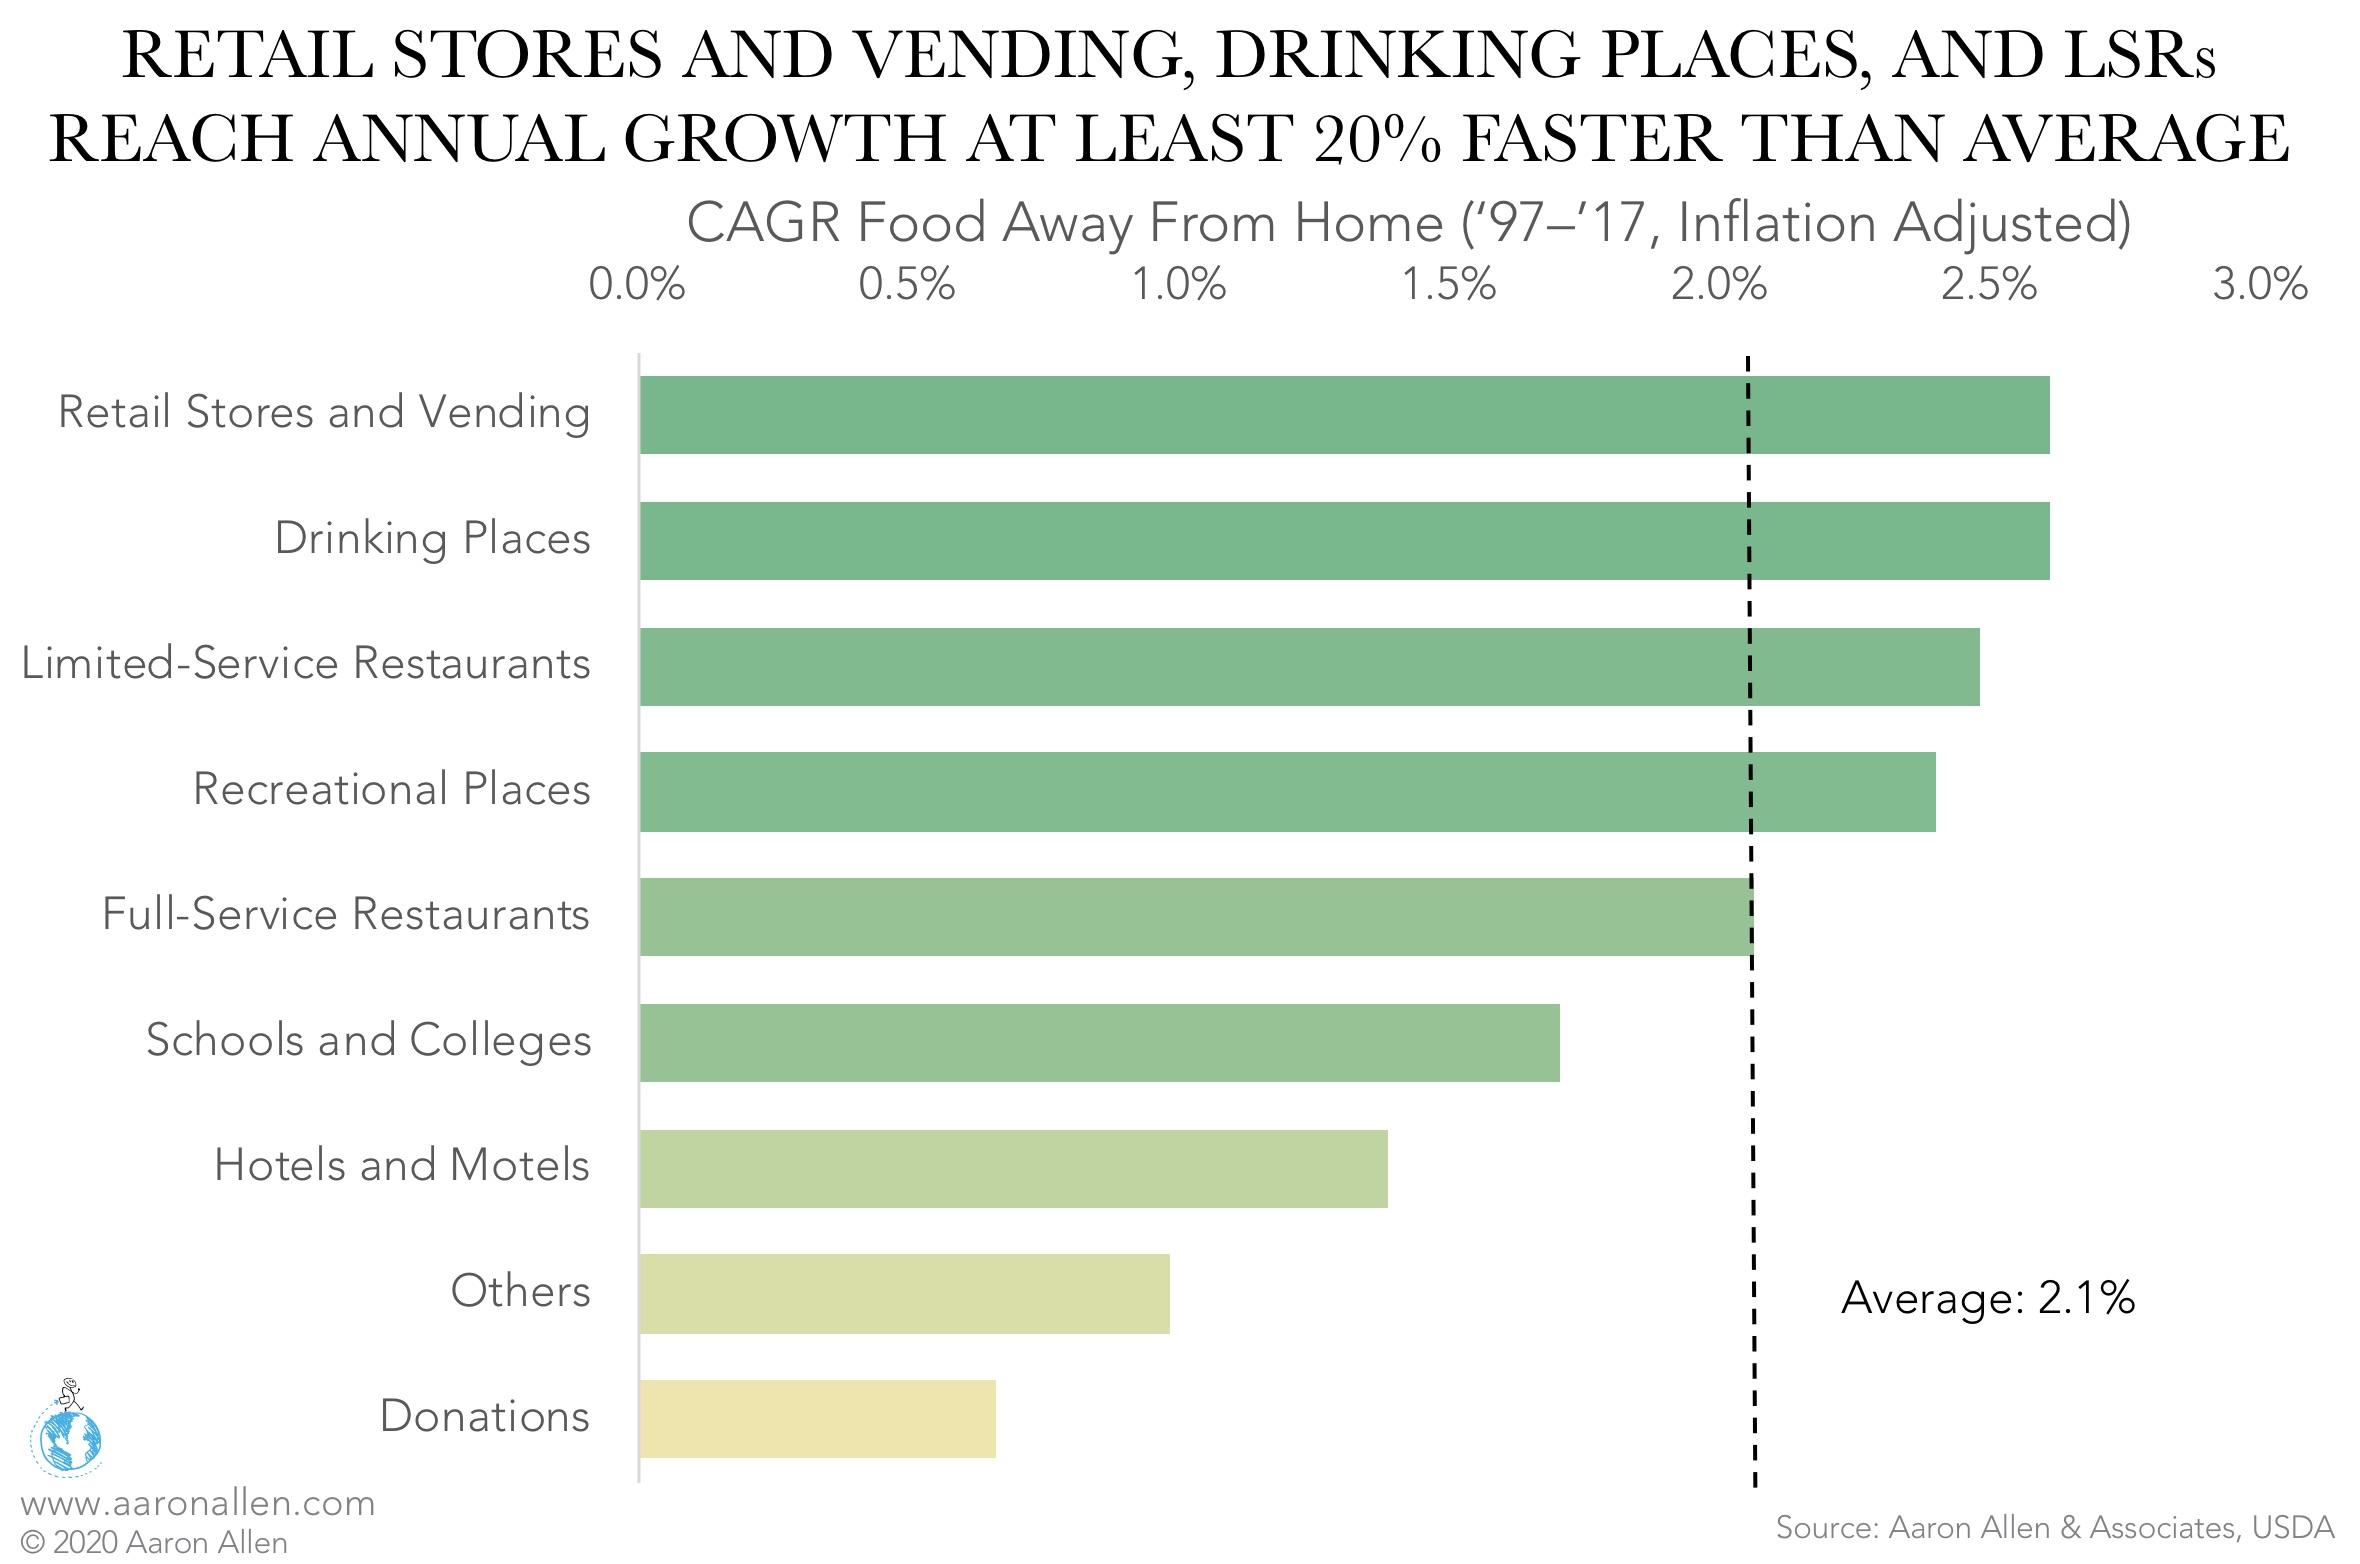
In the last 20 years, the U.S. restaurant industry has grown at a 2.1% CAGR (after accounting for inflation). Some segments, including retail stores and vending, drinking places, and limited-service (QSR and fast-casual restaurants), are growing at least 20% faster than average each year. Meanwhile, other segments, like full-service (casual dining and fine dining restaurants) schools and colleges as well as hotels and motels, are struggling to keep up. Quantifying the opportunity in a specific category allows for targeted expansion strategies and lower risk.

QSR and Casual Dining Restaurant Growth

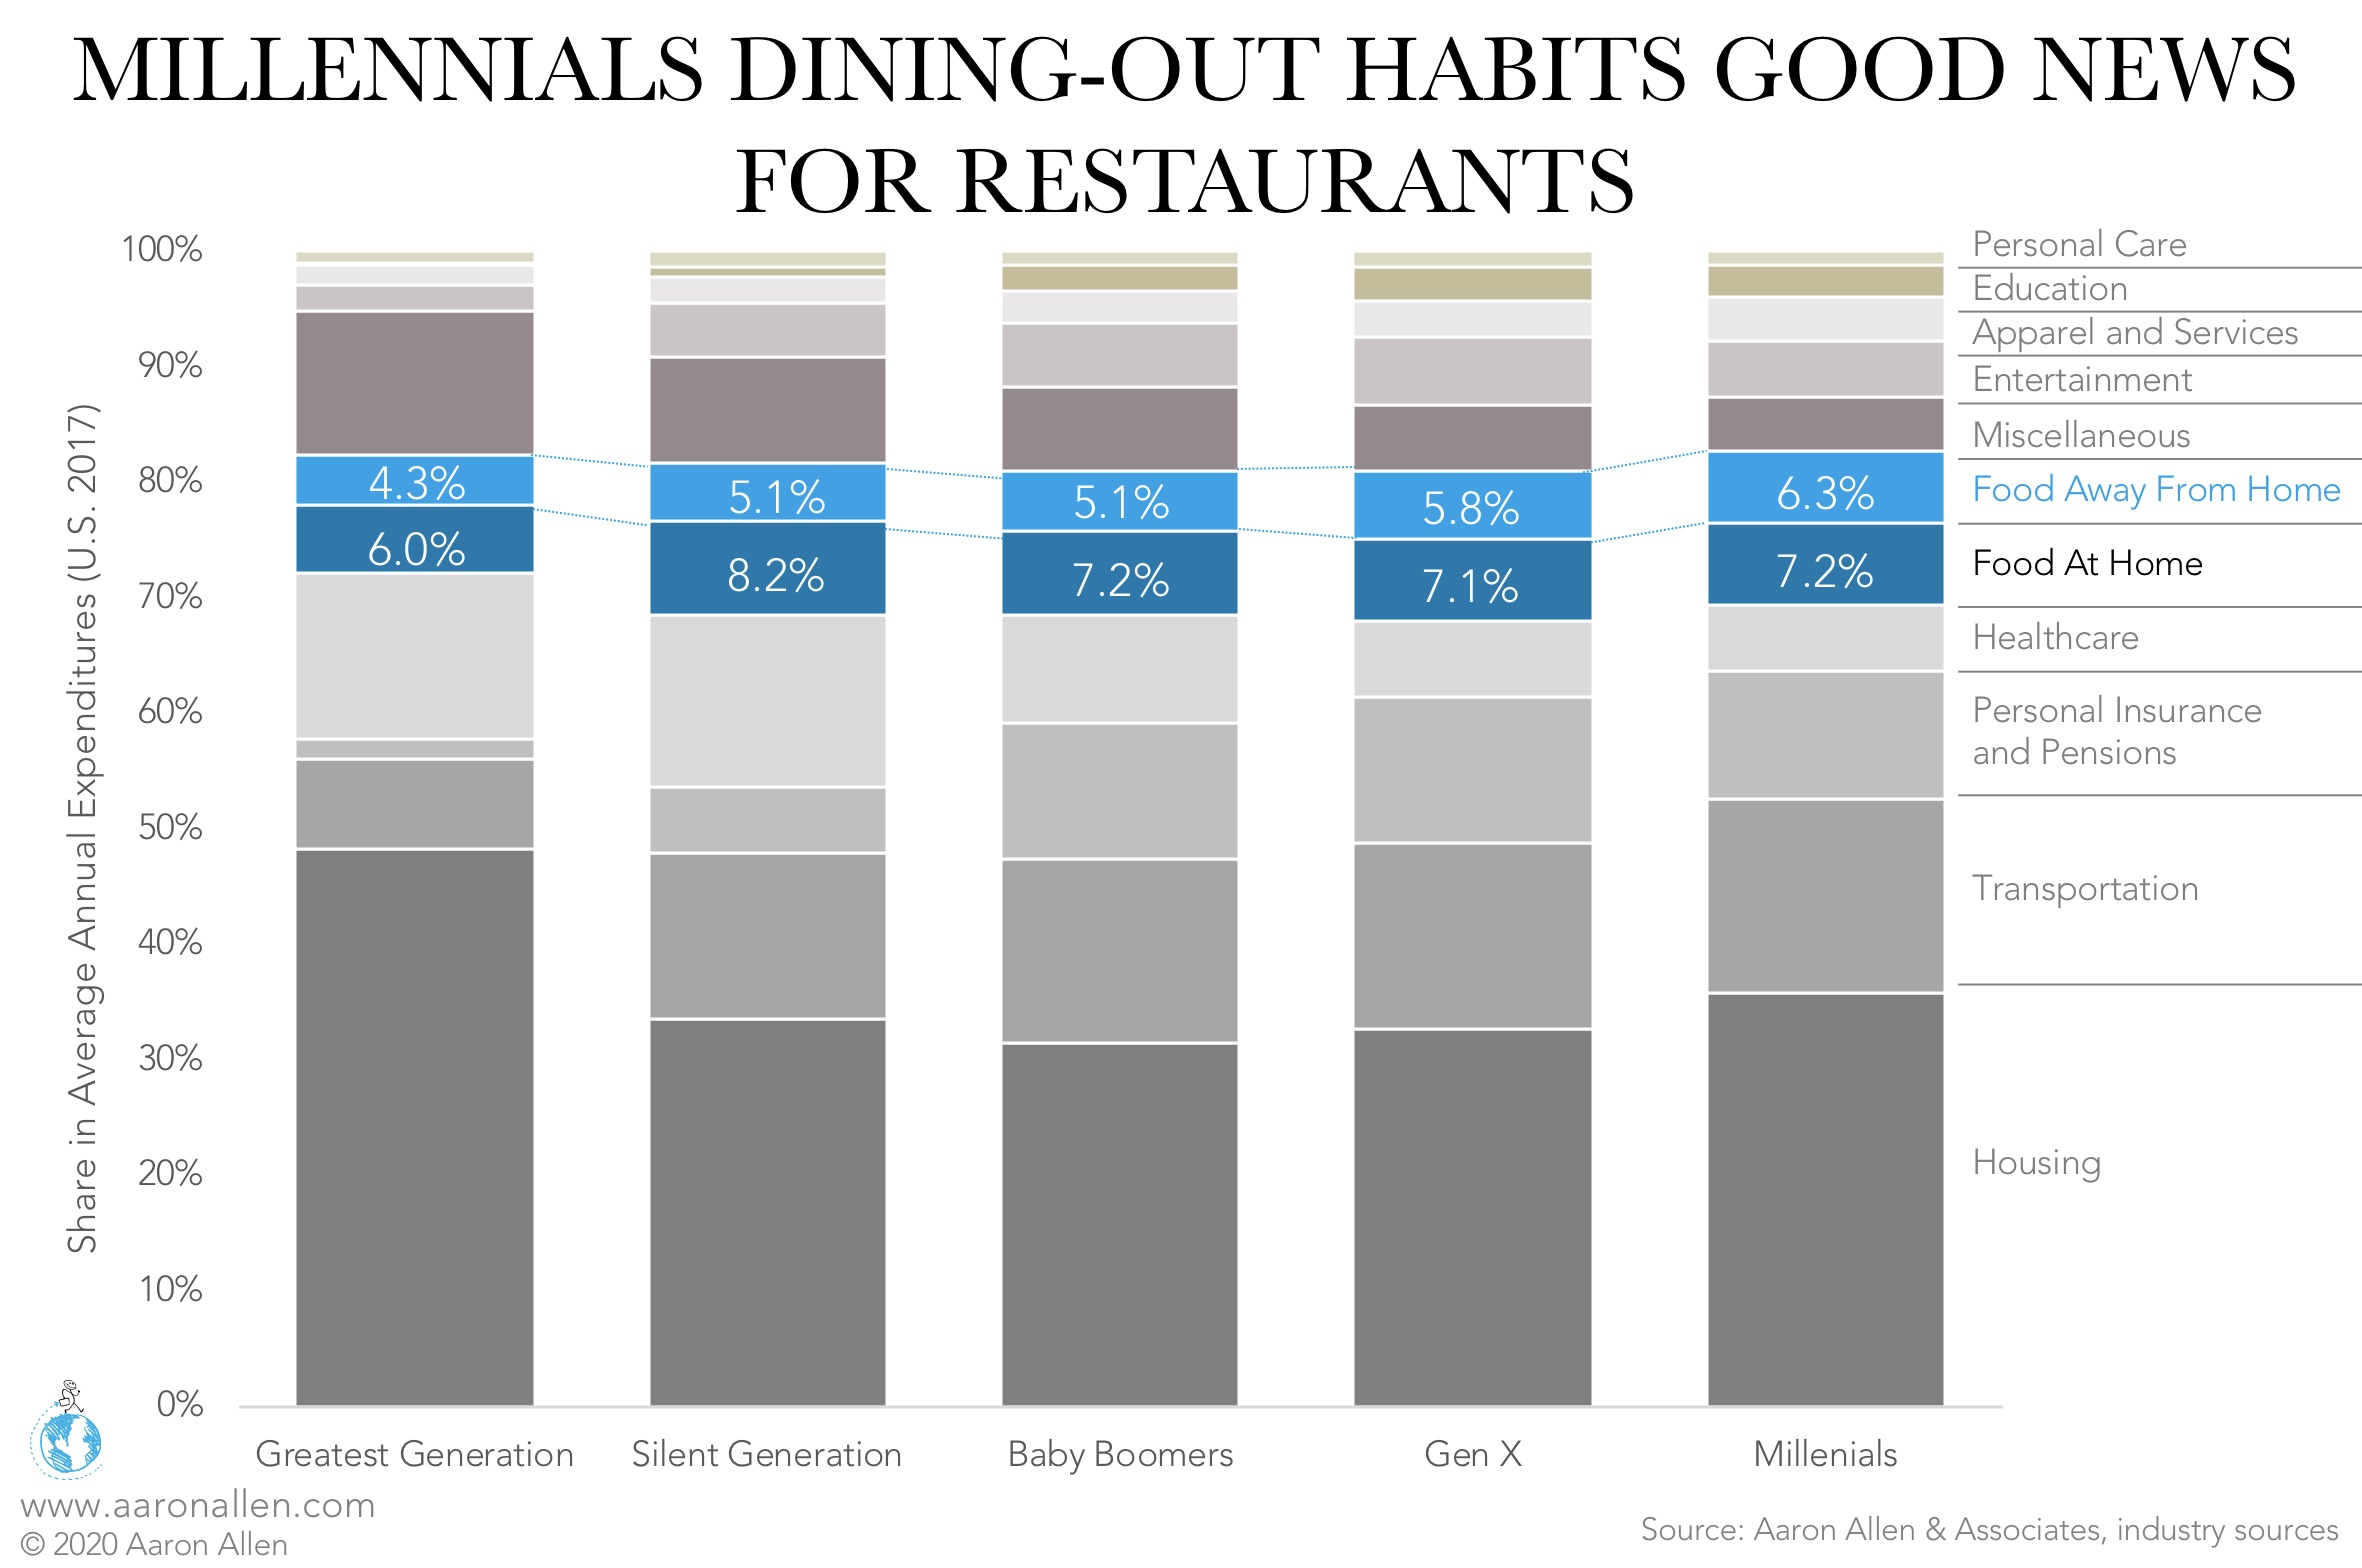
“Millennials” are one of the most common buzzwords when discussing restaurant trends. Though Millennials make less than both Gen X (who earn 41% higher wages) and Baby Boomers (23% higher wages), this young groups devotes a larger percentage of their expenses to dining out than any other generation (6.3% of annual expenditures). In fact, they spend more on food overall, likely a result of their generational preference for healthy diets. As this cohort ages and sees increases in discretionary income, they will continue to have a profound effect on the foodservice industry.

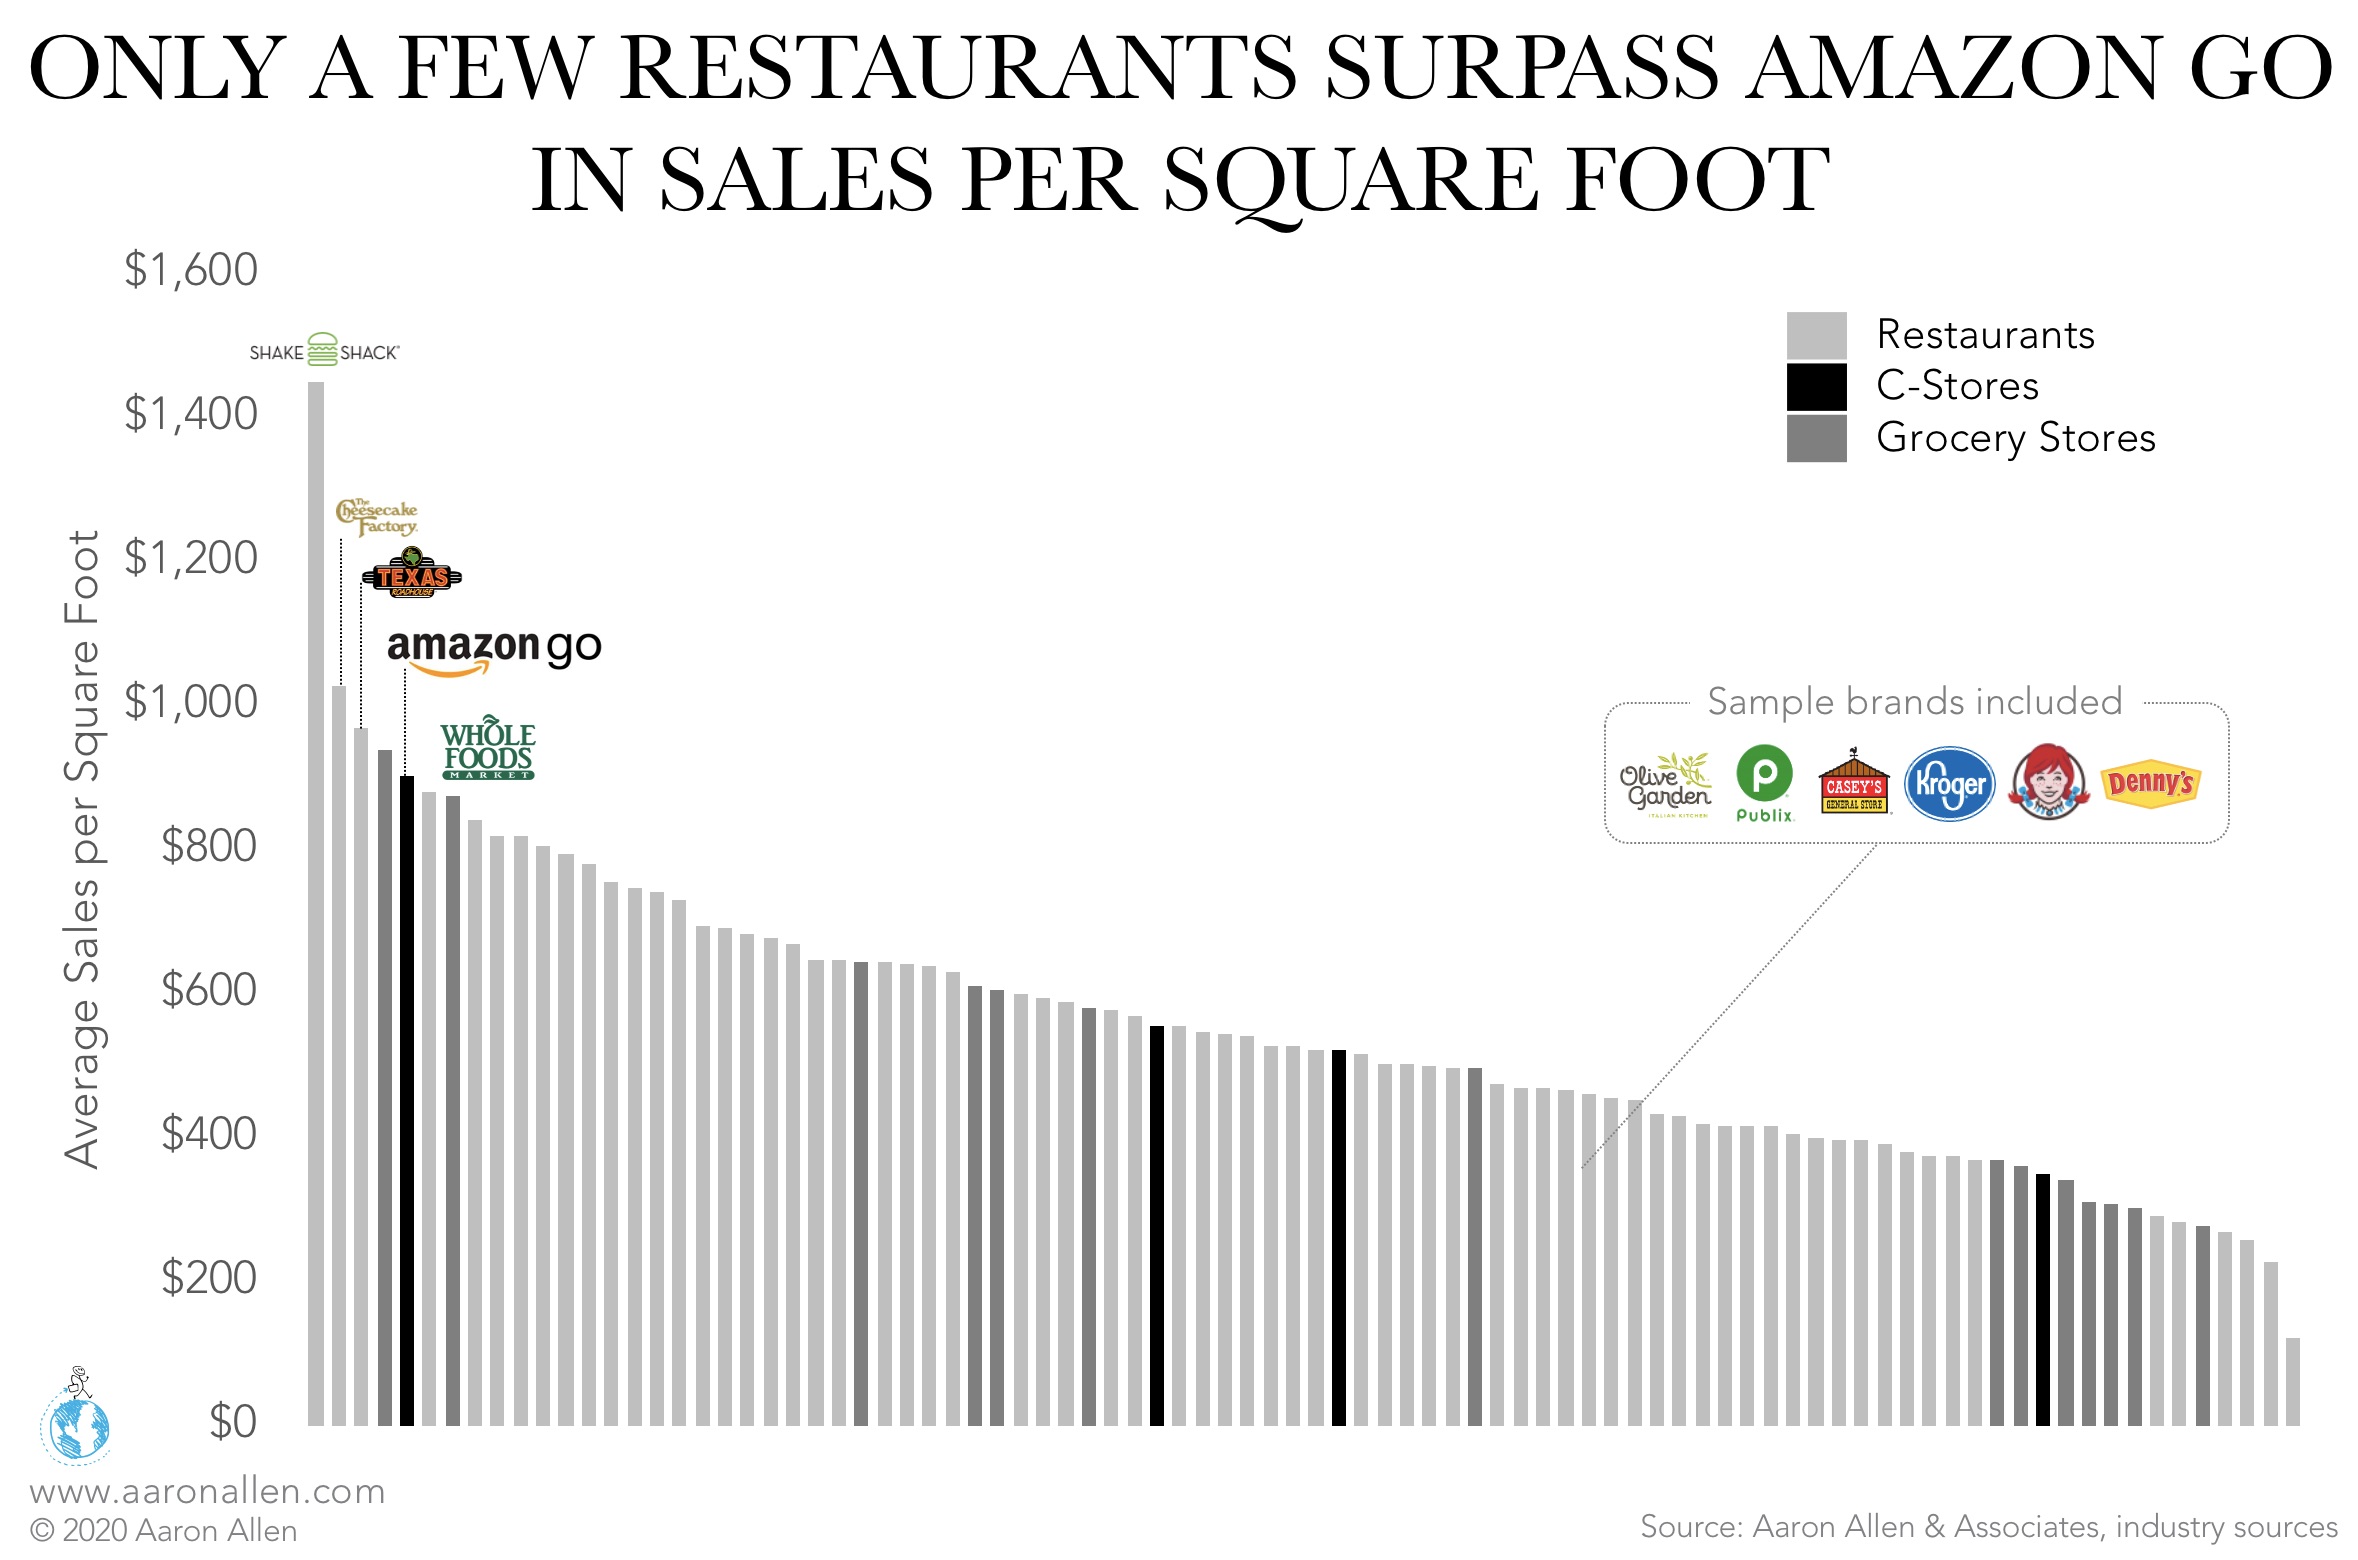
Amazon is converging several weapons it has built or acquired into something more deadly than any one component (Amazon Go, Amazon Restaurants, Amazon Basics, Amazon Fresh, Prime Now, one-click ordering, voice ordering, Whole Foods) is, independently. And though the unit models for grocery stores or C-stores are different than those for restaurants — though we see these categories as competitors for share of stomach and wallet of the same consumer; only a handful of restaurant chains surpass Amazon Go and Whole Foods in sales per square foot.

Restaurant Sales per Square Foot

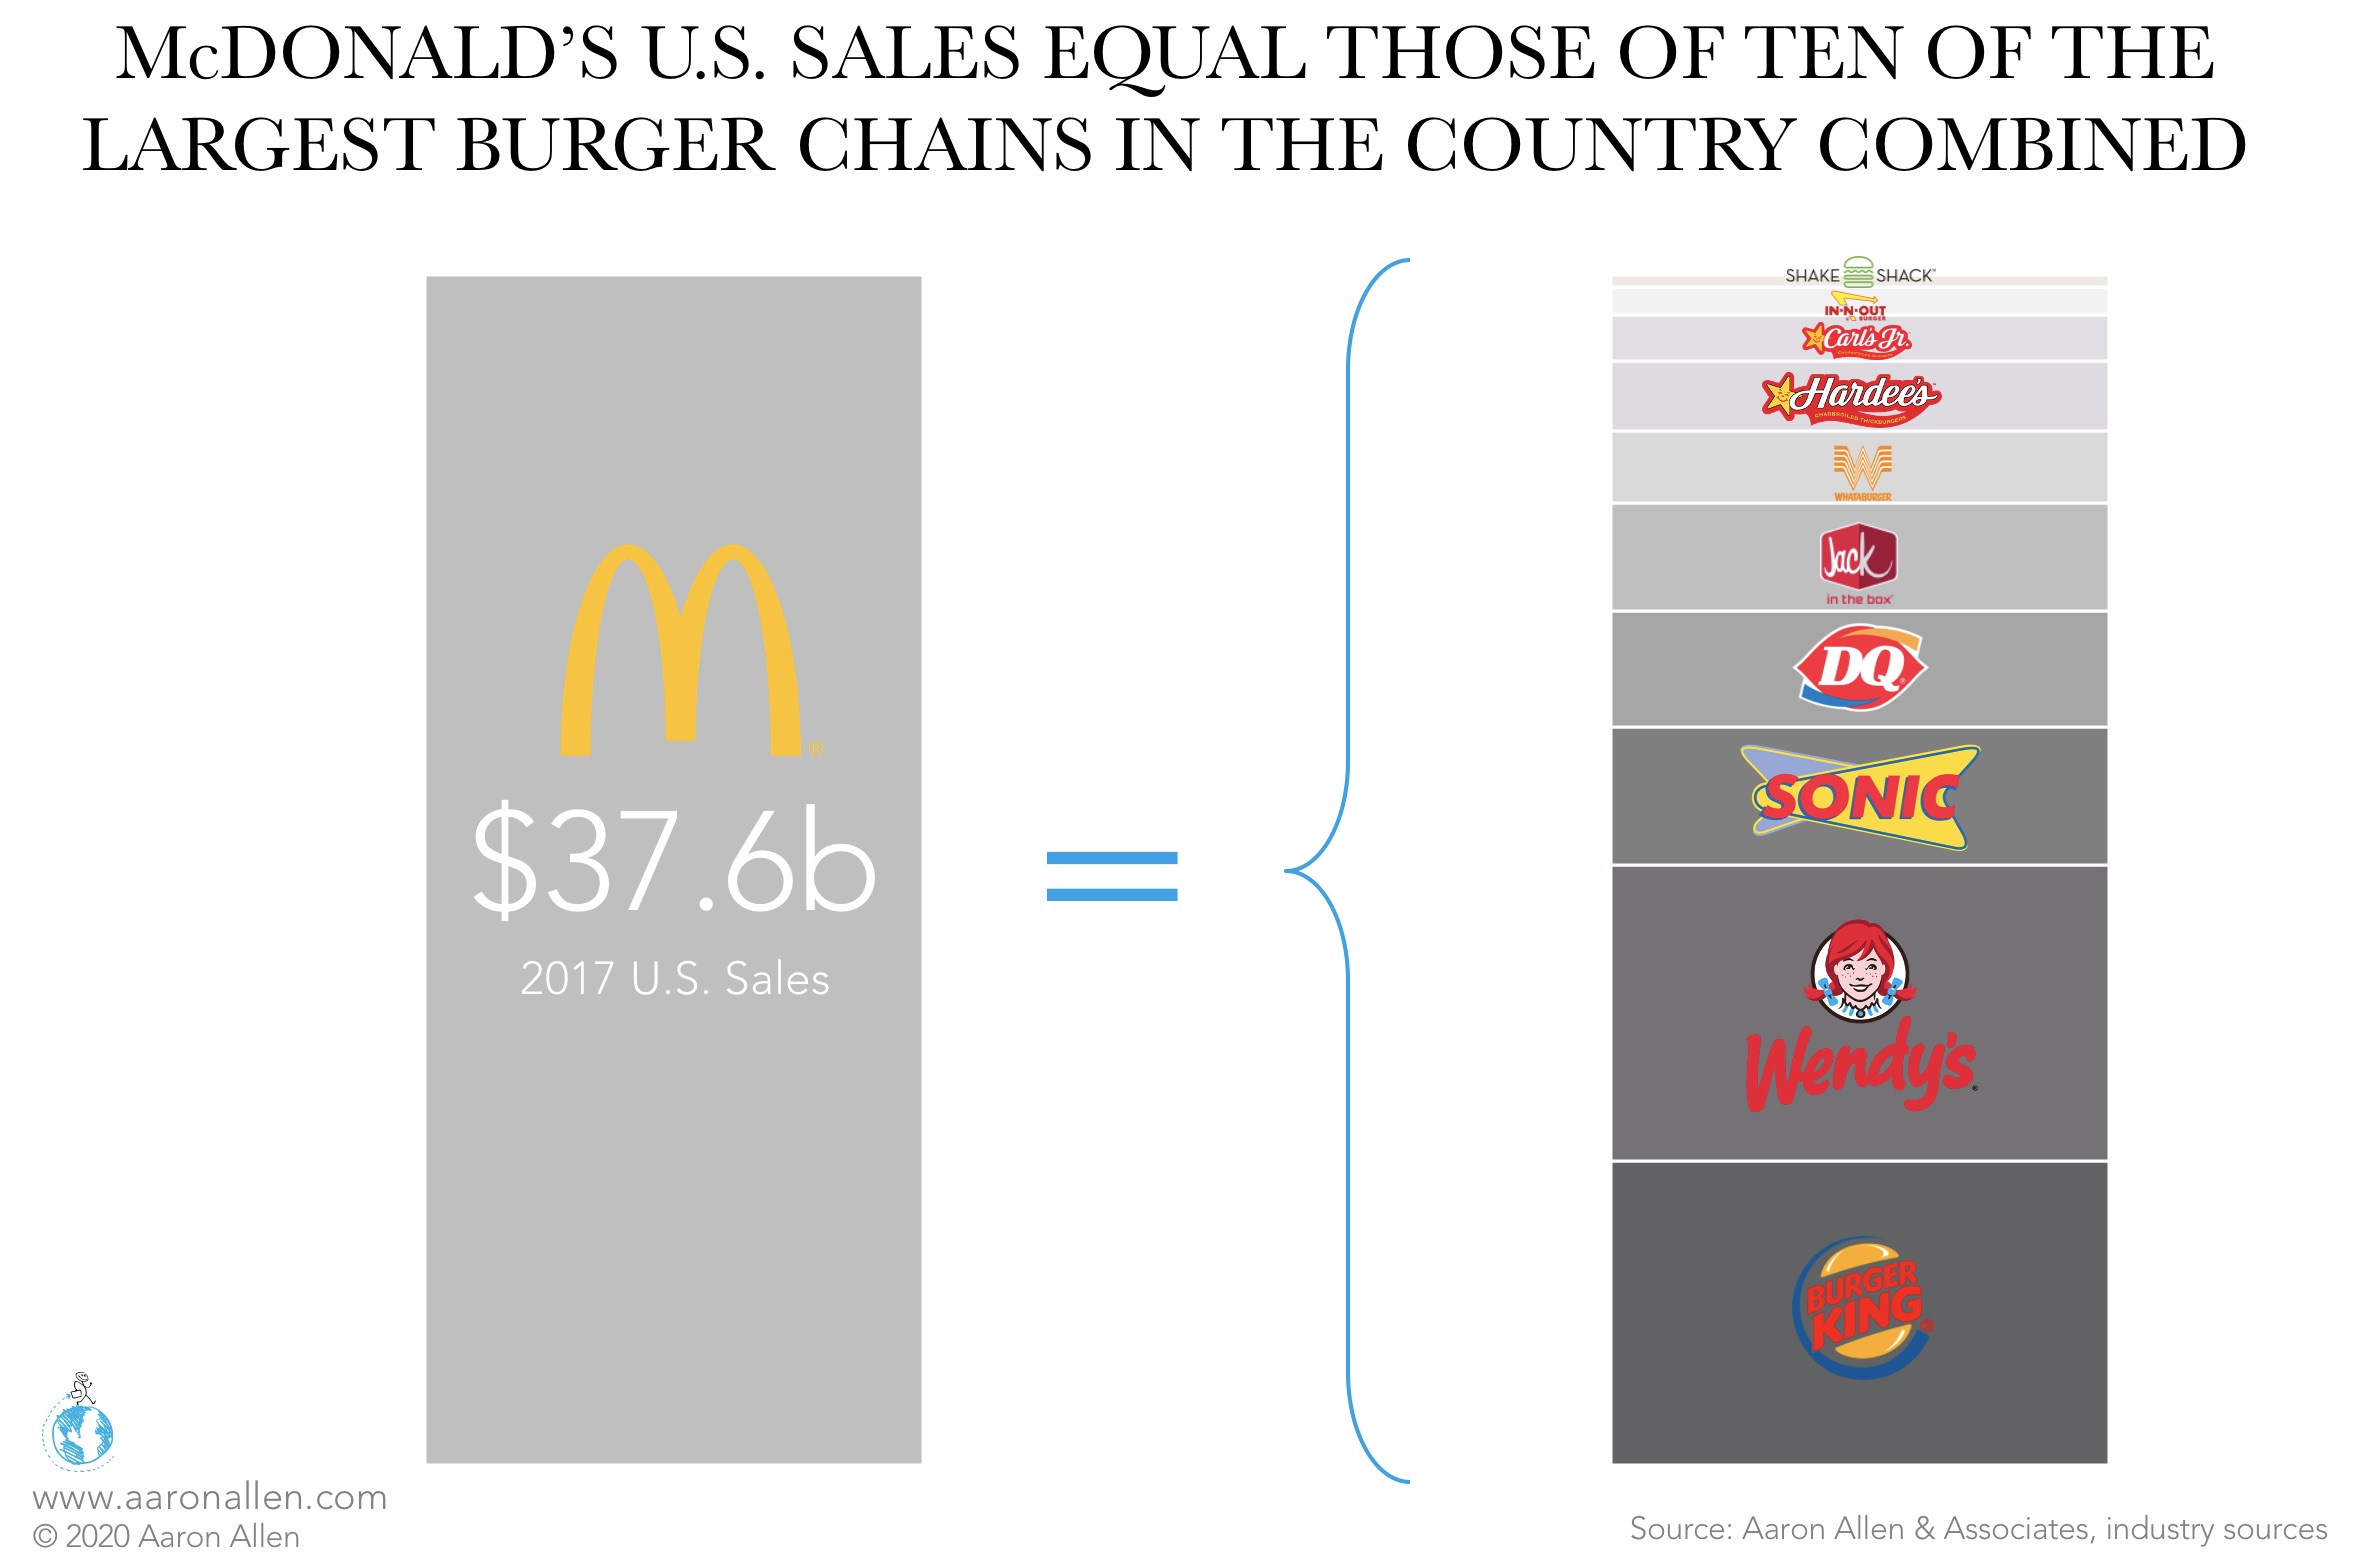
In 2017, McDonald’s sales in the U.S. reached $37.6b, amounting to about 5.5% of what Americans spend in restaurants. The leader in the burger segment has sales equal to those of ten of the largest chains combined. Burger King and Wendy’s (the second and third largest burger chains) only claim half of McDonald’s sales.

Largest Restaurant Chains Burgers

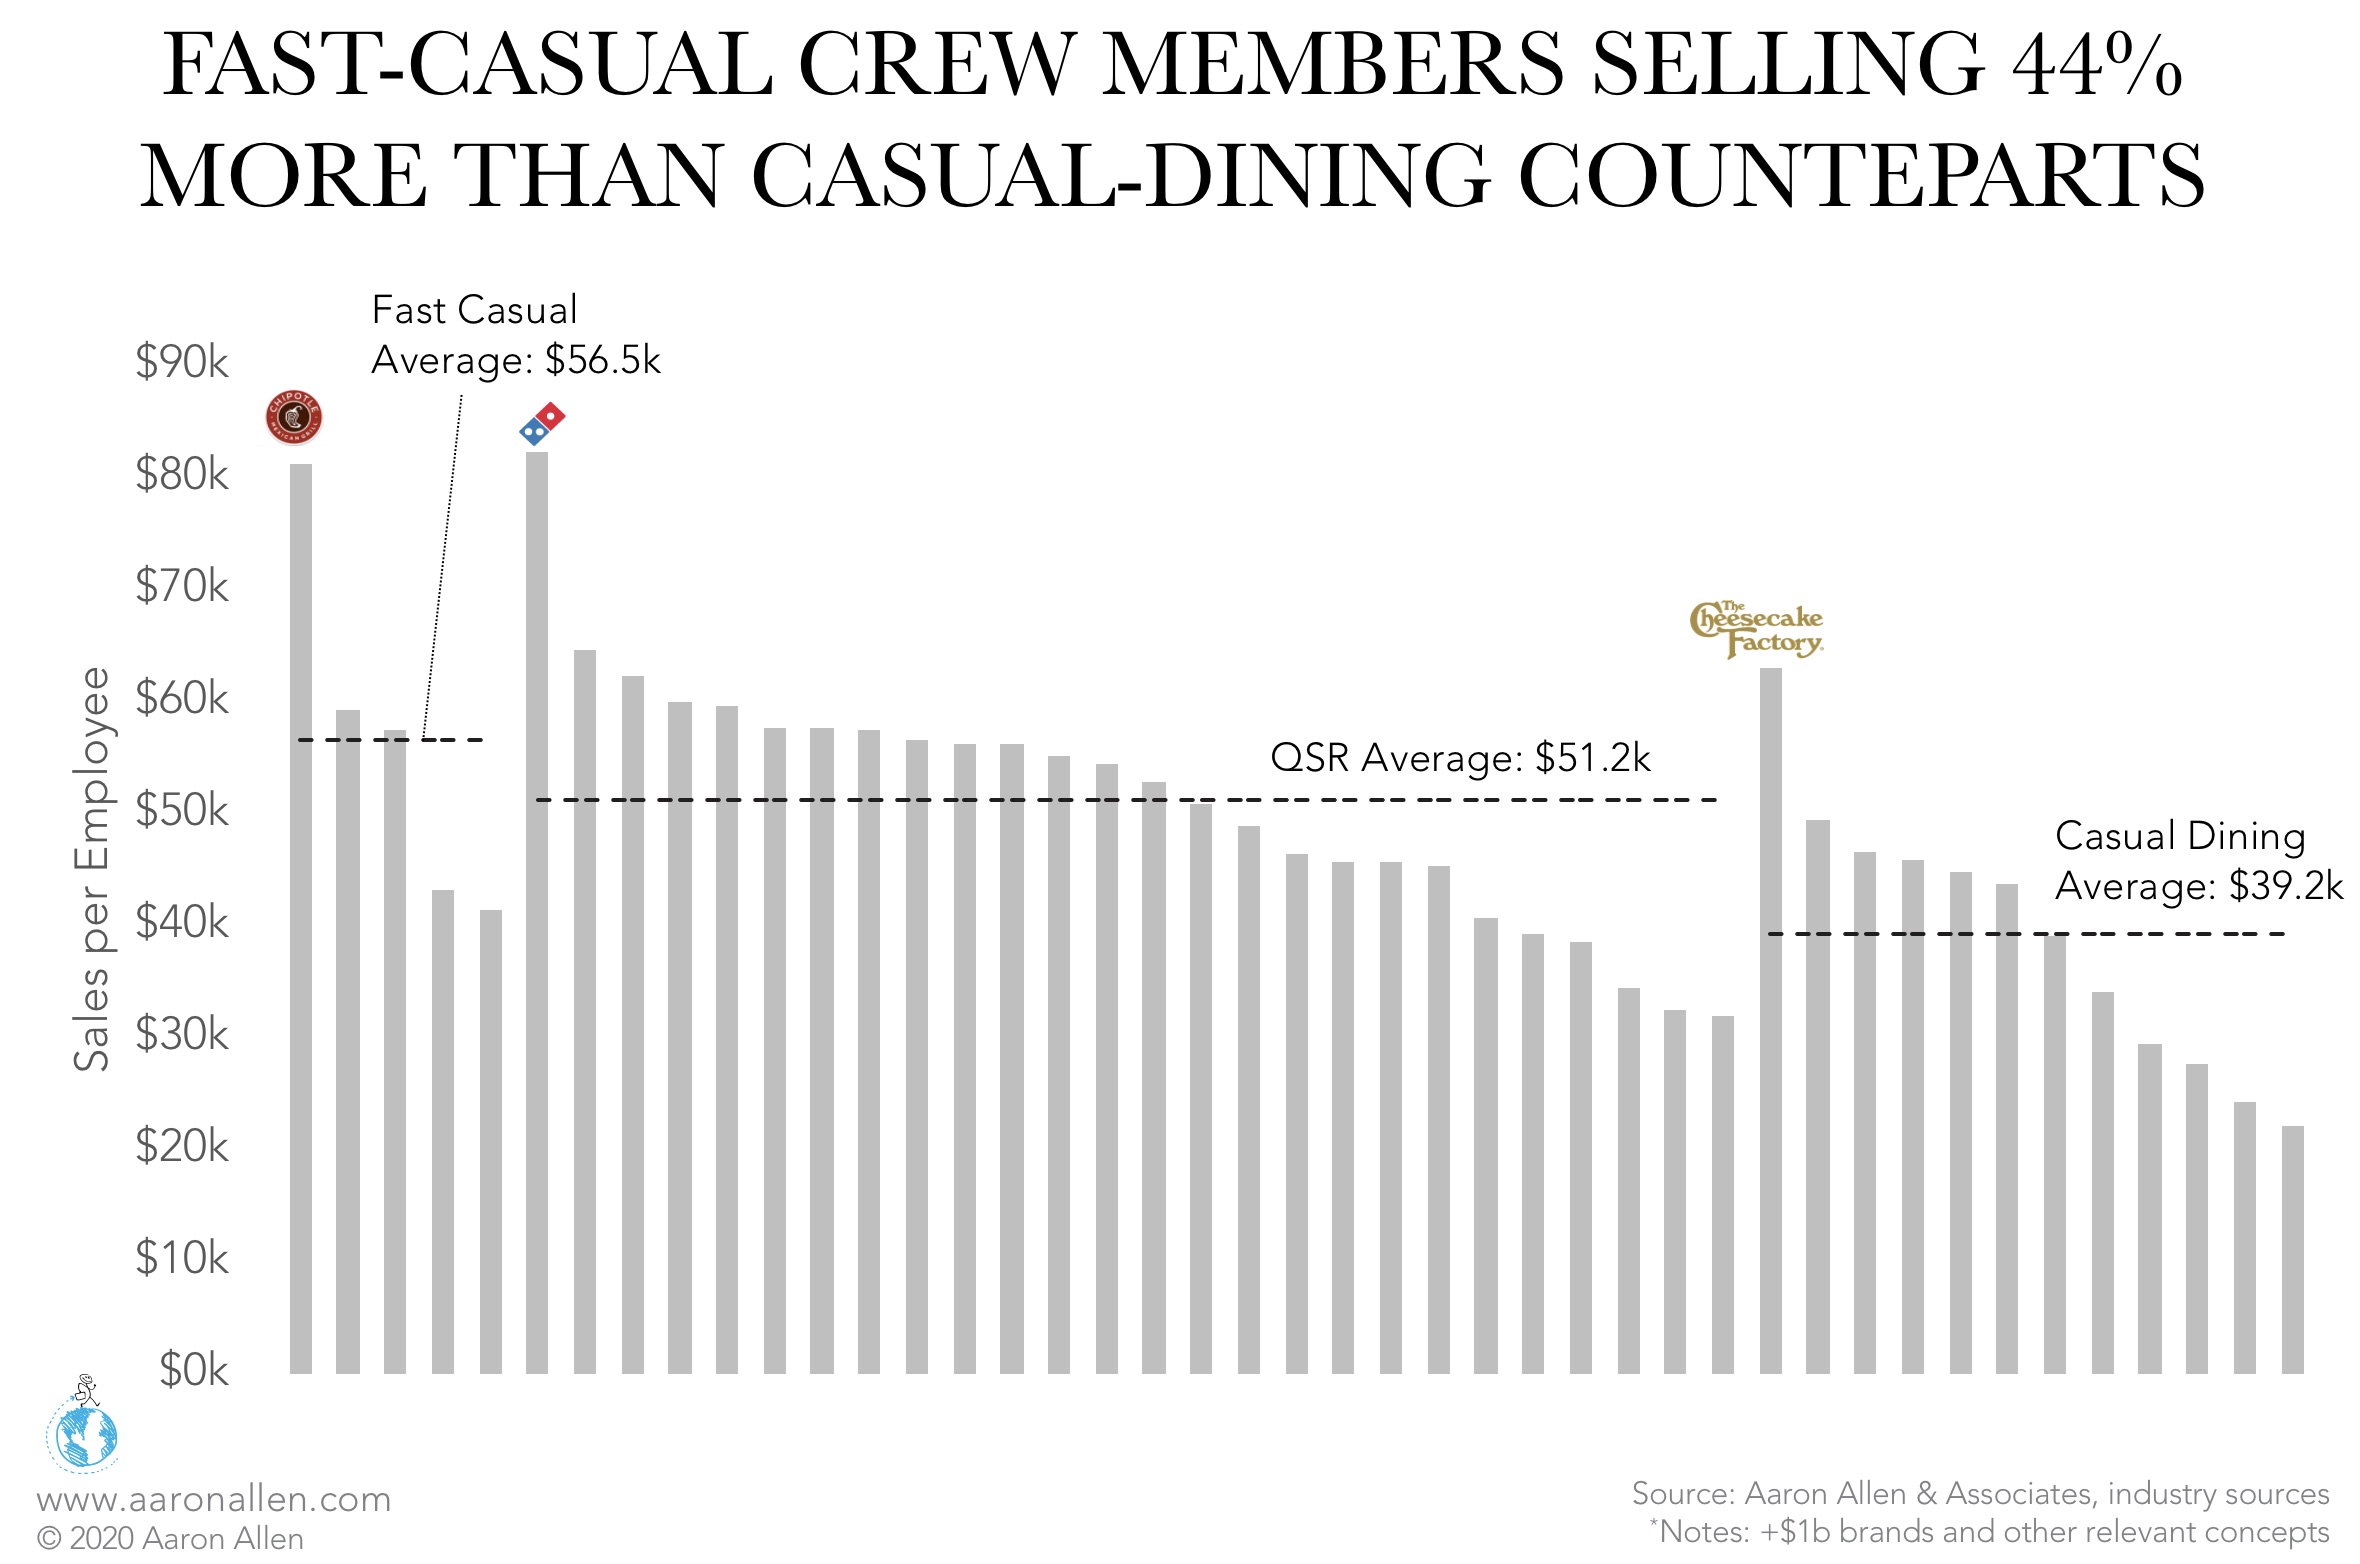
Fast-casual chains average 44% higher sales per employee ($56.5k per year) than their casual-dining peers ($39.2k per year). QSR chains are also more productive than the typical CDR operation, claiming 31% higher sales per employee. The swing within categories is large as well: the most productive fast-casual system makes twice the sales per employee as the least productive. That ratio is even higher for QSR (2.6x) and casual dining (2.8x). Performance optimization can help restaurant operators find gaps so that their systems compete with the most productive brands.

Fast Casual Restaurant Sales per Employee

Global Restaurant Industry Insights

  • The largest 30 restaurant chains in the world account for 12% of global sales of food away from home.
  • McDonald’s alone — the largest chain in terms of sales — receives $4 for every $100 of consumers’ spend in restaurants.
  • The top five chains are QSR players, with two of them (McDonald’s and Burger King) focused on burgers.
  • McDonald’s share is equivalent to that of the next four competitors (Starbucks, KFC, Burger King, and Subway) combined.

Food Service Companies Globally

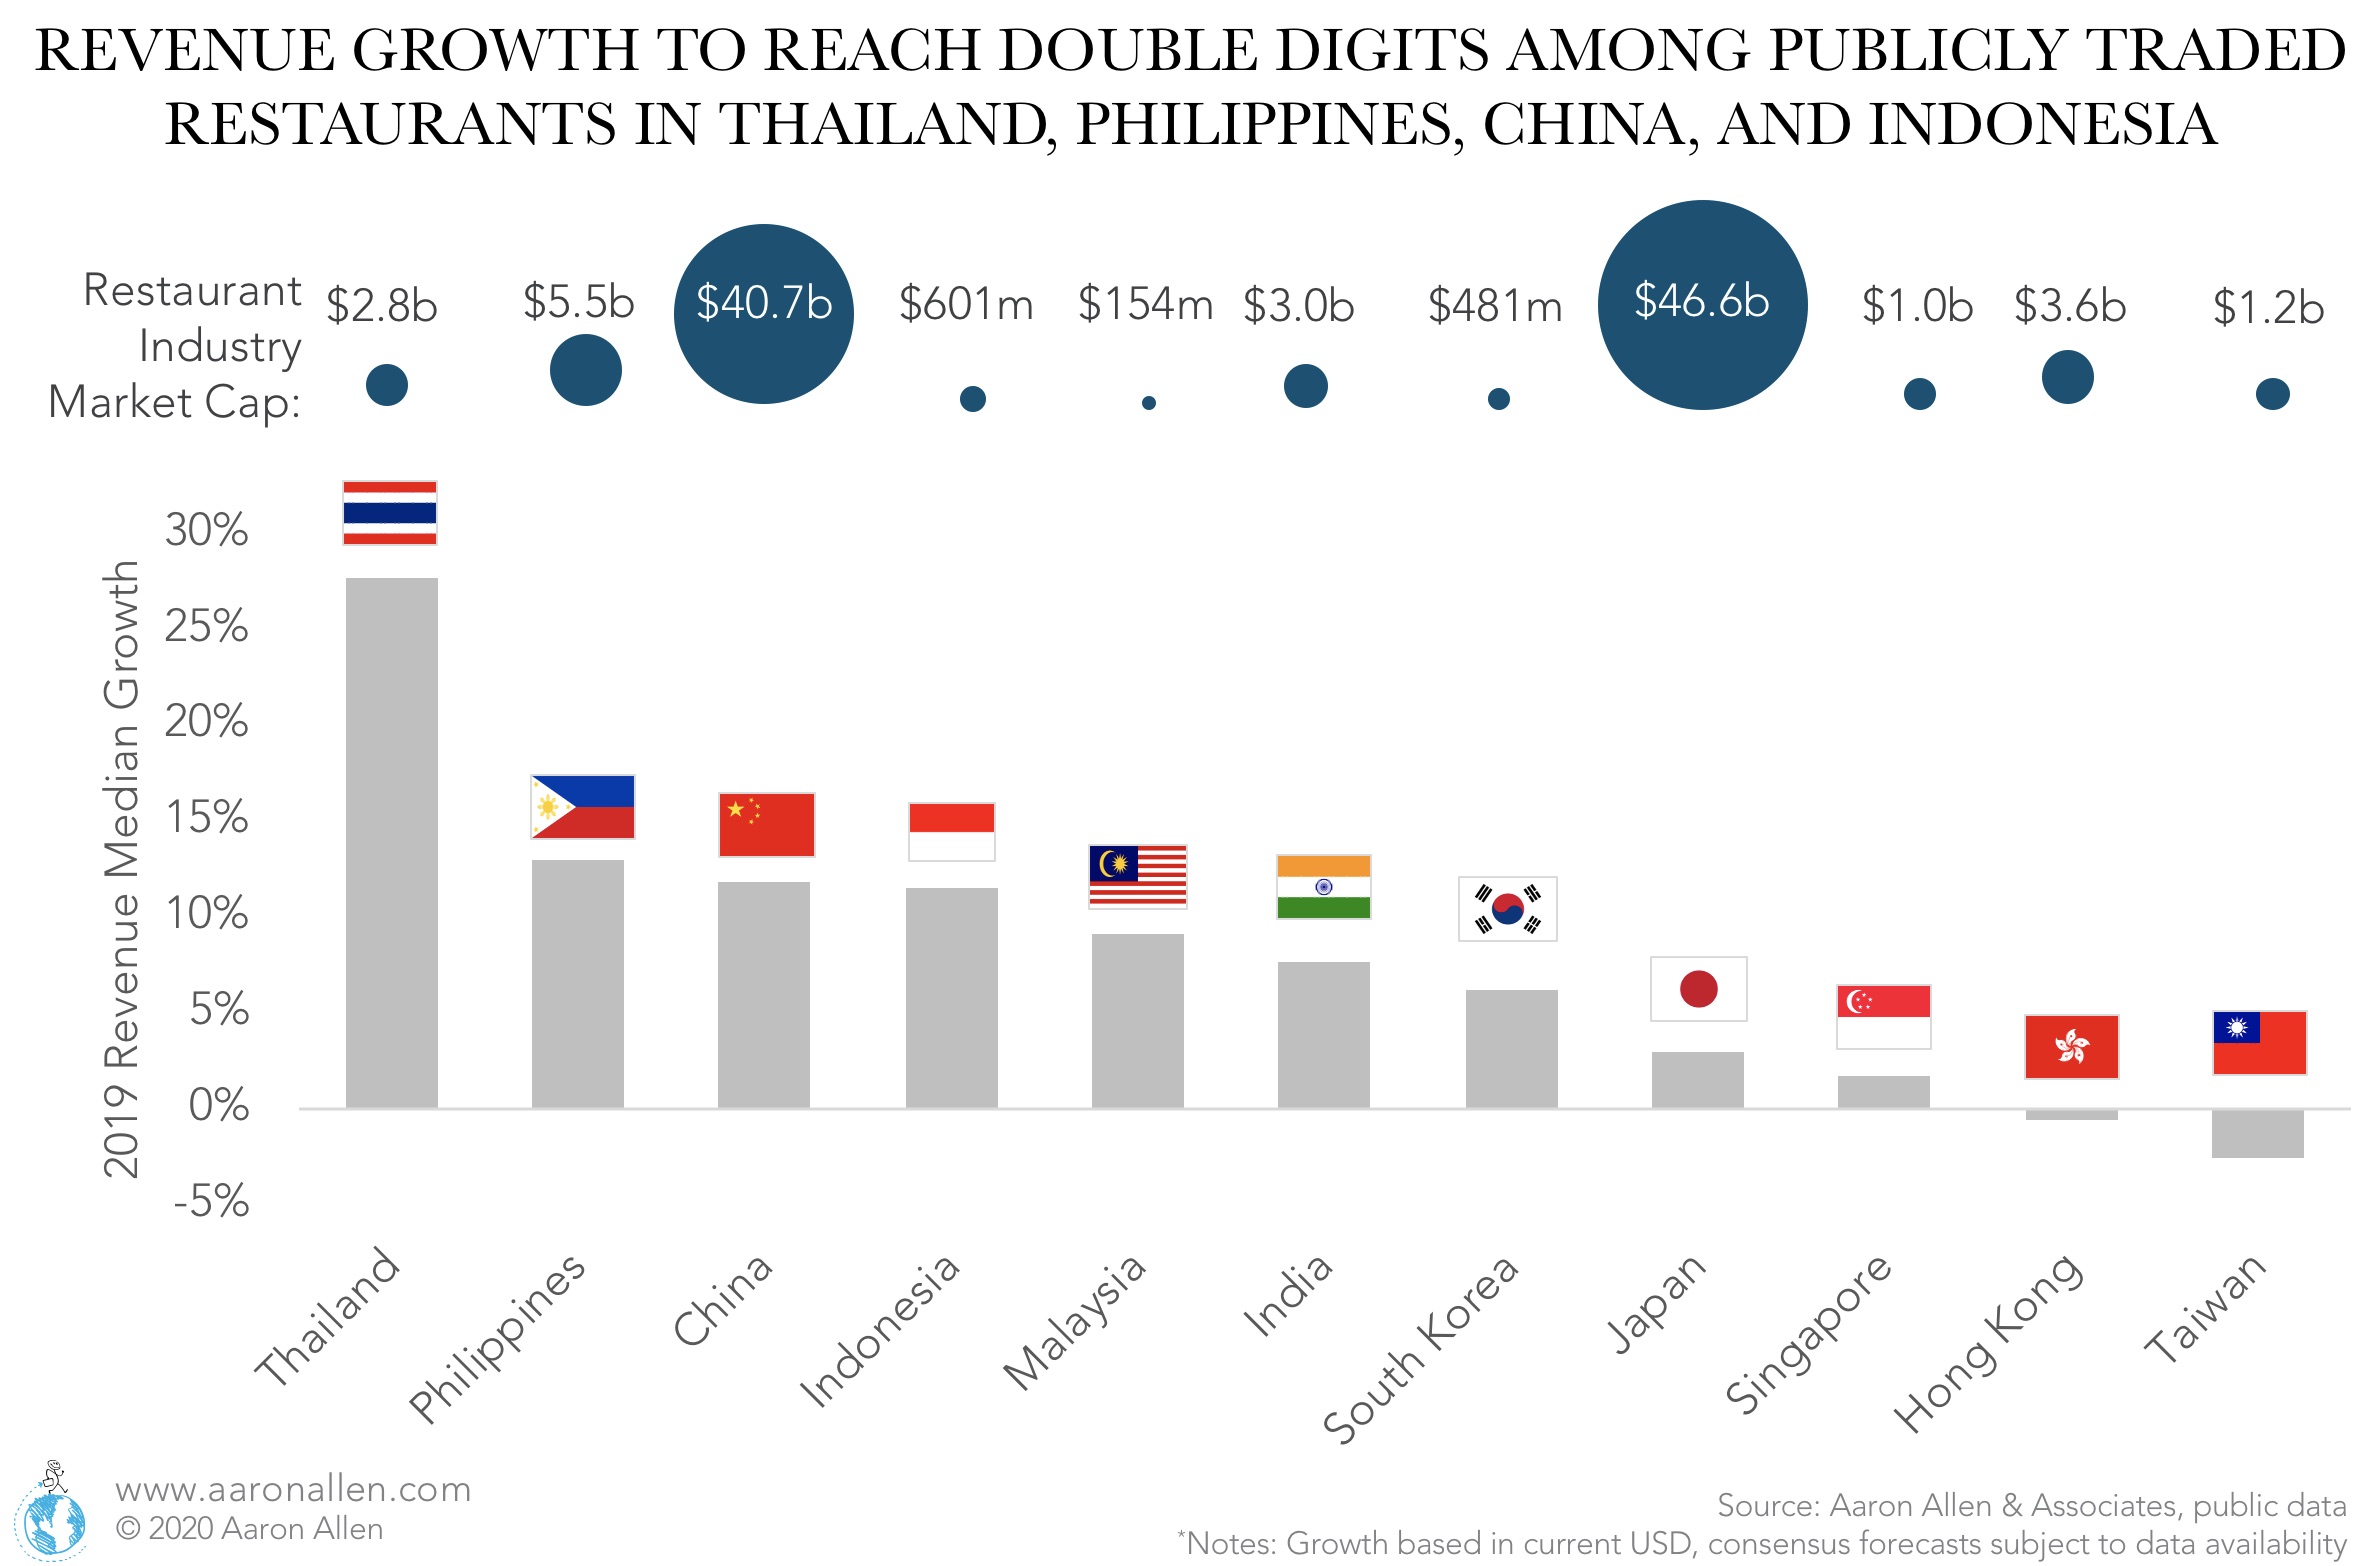
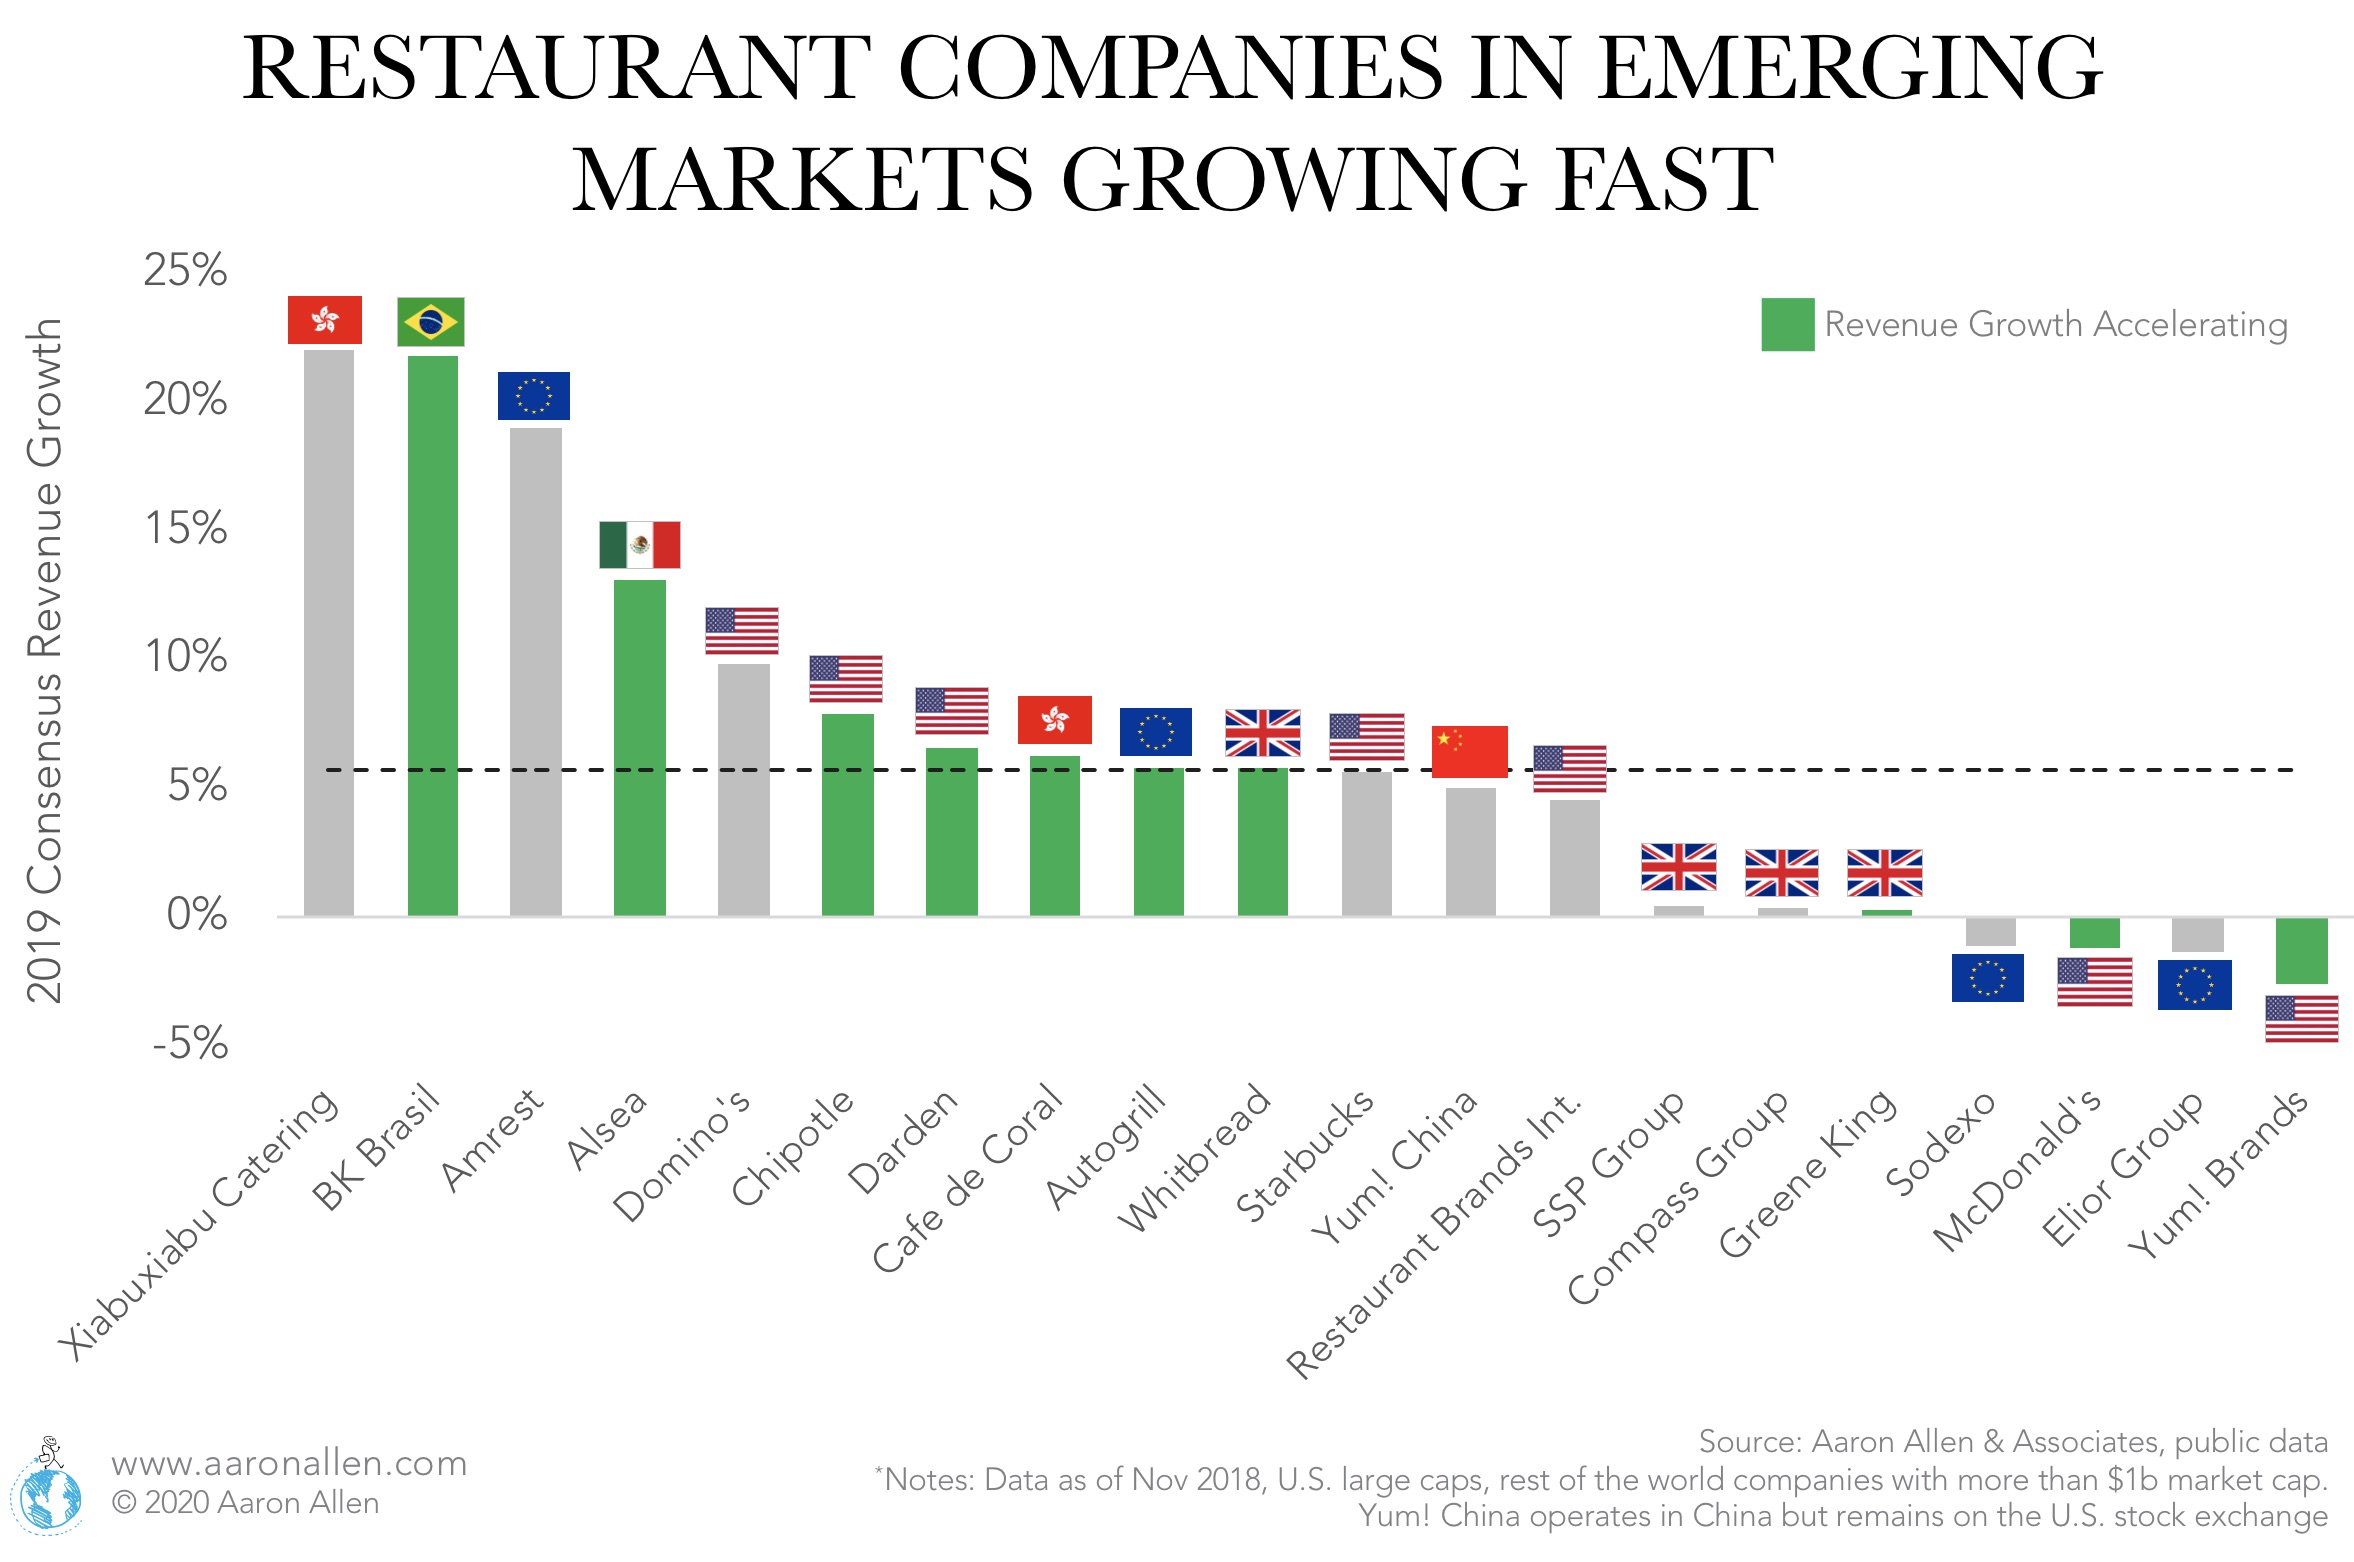
Consensus forecasts for twenty of the largest publicly traded foodservice companies around the world favor emerging markets. In this group, three of the five fastest growers (based on revenue) are in emerging markets: Xiabuxiabu Catering (a QSR hot pot chain), BK Brasil (Burger King franchisee), and Alsea (multi-concept operator of brands including Domino’s Pizza, Burger King, California Pizza Kitchen, Chili’s Grill & Bar, PF Chang’s China Bistro, and Starbucks). It’s worth noting that revenue growth may differ from sales depending on the organization’s franchise level, and some of the weakest growers, like McDonald’s and Yum! Brands, have recently undertaken re-franchising initiatives.

Restaurant Chains Hong Kong Mexico Brazil

Publicly traded restaurants in some Asian Pacific emerging markets including Thailand, the Philippines, China and Indonesia are expected to reach double-digit growth medians in 2019. China, India, and others in the region have some of the lowest chain restaurant penetration levels in the world. These markets pose an opportunity for foodservice brands willing to invest in strategic plans that will secure a successful cross-border expansion.

Restaurant Industry Asia China India

Frequently Asked Questions

1. How many restaurants are there in the U.S.?

According to the BLS, the number of restaurants in the U.S. is estimated at 652.8k as of 2019 (averaging preliminary estimates for Q1-Q3). This counts only establishments registered as Food Services and Drinking Places. Other sources like the National Restaurant Association put that number closer to 1 million restaurants. The difference may be partially due the classification of restaurants in entertainment venues like theaters and amusement parks (left out of the NAICS classification).

2.  What is the classification for a restaurant? 

In the North American Classification System (NAICS) Restaurants are classified within Sector 72: Accommodation and Food Services. The Food Services and Drinking Places subsector (classified with the code 722) consists of full-service restaurants (including casual dining, fine dining, family dining, etc.), limited-service eating places (including quick-service restaurants and fast-casual establishments), special food services (food trucks, cafeterias at schools, airline food, concession contractors, caterers, etc), and drinking places (mainly bars and taverns).

3. What are the advantages of franchising in the restaurant industry?

For the franchisee: being able to invest in an established business rather than starting from scratch. The restaurant franchisee gets can leverage a brand, getting access to SOP, marketing, support with management and training, and oftentimes financing. The franchisee pays an initial investment (subject to the number of locations it will open) and typically a franchise fee (royalties) that is a fix percentage of sales.

For the franchisor (the brand owner), scalability (faster growth with a lower capital requirement) and moving to an asset-light model are key advantages of franchising. The franchisor is able to delegate the costs of new units, remodels, and upgrades to franchisees.

4. What are fast-casual restaurants?

Fast Casual Restaurants are a subset of limited-service restaurants that have a slightly higher service level and price point (often also a higher quality product) than Quick Service Restaurants. Chipotle, Panera, Shake Shack and Five Guys are some examples. The sales per employee of fast-casual restaurants ($56.5k annually in the U.S.)  are on average higher than those for QSR or Casual Dining. Fast Casual represented only 5% of publicly traded restaurants enterprise value as of March, 2019.

5. Which segment of the restaurant industry is the most profitable?

The profit margin for restaurants reaches a median of 3.5% in the U.S. (similar to other mature markets, but lower than in many emerging countries). QSR (popularly referred to as “fast food”) typically reaches the highest margins (in publicly traded markets in the U.S. that is 10.6% as of 2017). Casual dining, on the other hand, is usually on the weaker side in terms of profitability (3.1% median for U.S. publicly traded).

6. How big is the foodservice industry in the U.S.?

In the United States, the sales of Food Away From Home reached $854 billion in 2019. That is an average $71.2 billion monthly. The growth for 2019 averaged 1.7% over 2018 (corrected by inflation).

7. Why work in the hospitality industry?

Making things easier on others is part of what the hospitality industry is founded on. Skills learned while working in restaurants are fundamental — everything from time management to empathy — and can serve as a foundation for success across other industries, as well. 


Glossary of Terms

Consumer Foodservice: Includes Food Services and Drinking Places that prepare meals, snacks, and beverages to customer order for immediate on-premises and off-premises consumption. Included are chained and independent establishments in the following categories: Full-Service Restaurants, Limited-Service Restaurants, Convenience Stores, Self-Service Cafeterias, Street Kiosks (including Food Trucks), Cafés, Bars, and Takeaway/Delivery-Only. These figures are exclusive of contract foodservice.

Contract Foodservice: Commercial and non-commercial managed services or onsite food-service and food contractors (including food sold at hospitals, nursing homes, colleges, universities, schools, and airlines).

Chained Foodservice: General term for an organization with multiple locations operating under the same brand (as opposed to independent restaurant operators). For the purposes of this report, chained brands typically have at least ten locations.

Independent Restaurants: Restaurant businesses with one or a handful of locations. These are often small businesses, and restaurant owners tend to run the operations. 

Food At Home (FAH): Food prepared and consumed at a personal residence. This can be thought of generally as grocery store purchases.

Food Away From Home (FAFH): Food prepared outside of the residence, including at restaurants, convenience stores, cafés, etc. Delivery is also considered food away from home.

Full-Service Restaurants (FSR):  A sit-down eatery where food is served directly to the customers’ table. These establishments may sell alcoholic beverages and may also provide takeout and delivery. FSRs can range from casual and family dining to fine dining.

Limited-Service Restaurants (LSR): Establishments whose patrons generally order or select items and pay before eating. Food and drink may be consumed on premises, taken out, or delivered to customers’ locations. This includes fast casual and quick service restaurants. These establishments may also provide takeout and delivery.

Quick-Service Restaurants (QSR): A subset of limited service restaurants, QSRs are commonly referred to as “fast food” establishments. Examples of this category include McDonald’s, Burger King, Wendy’s, etc.

Fast-Causal Restaurants: A subset of limited service restaurants with a slightly higher service level and price point than QSRs. Examples of this category include Chipotle, Panera, Shake Shack, etc.

Casual Dining Restaurant (CDR): A subset of full-service restaurants known for serving moderately priced food in a casual atmosphere. Examples include Applebee’s, Chili’s, TGI Friday’s, etc.

Same-Store Sales (SSS): A performance comparison for stores open during a comparable time-frame (typically on either a quarterly or annual basis). SSS is one of the clearest indicators of performance at a unit- and system-level. This is also sometimes referred to as like-for-like sales, or comparable store sales.

CAPEX: Capital expenditure funds used by an organization to acquire, upgrade, and maintain physical assets including property, plants, equipment, technology, etc. CAPEX funds can also be allocated to strategic investment opportunities related to mergers and acquisitions.

Mergers & Acquisitions (M&A): Overarching term referring to the consolidation of companies or specific assets through a variety of financial transactions. M&A activity is often motivated by a combination of strategic and financial drivers.

Key Performance Indicators (KPIs): A quantifiable measure used to evaluate the success of an organization, department, unit, or employee in meeting objectives for performance.

PESTLE: A framework to track the business environment in which an organization is operating including Political, Economic, Social, Technological, Legal, and Environmental factors.

Relying primarily on the corporate intelligence that resides solely within your own organization is like relying on a radar system that tracks only your planes and troupe movements.

When the stakes are high, challenging assumptions helps dissipate the cloud of bias that can fog big decisions. We provide tailored insights about what’s now and what’s next — and why it matters — to help companies become faster, leaner, and more agile. If you’re too busy to think much about any of these factors, hire someone else to.

ABOUT AARON ALLEN & ASSOCIATES

Aaron Allen & Associates works alongside senior executives of the world’s leading foodservice and hospitality companies to help them solve their most complex challenges and achieve their most ambitious aims, specializing in brand strategy, turnarounds, commercial due diligence and value enhancement for leading hospitality companies and private equity firms.

Our clients span six continents and 100+ countries, collectively posting more than $200b in revenue. Across 2,000+ engagements, we’ve worked in nearly every geography, category, cuisine, segment, operating model, ownership type, and phase of the business life cycle.