

Restaurant Valuations in 2023
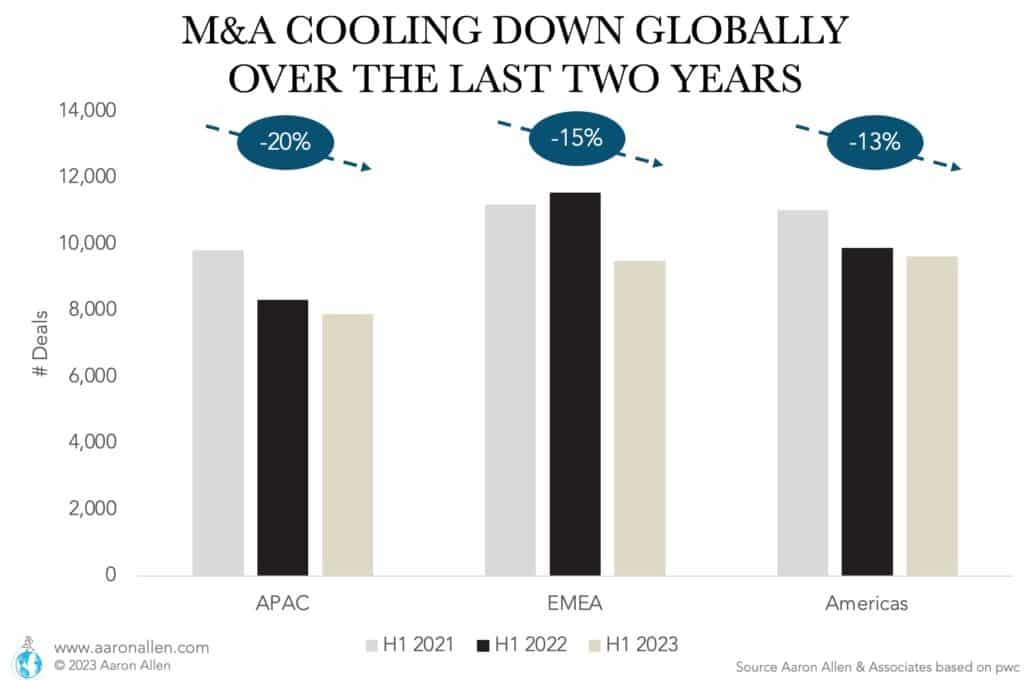
M&A activity cooled down globally in 2022 and in the first half of 2023. Uncertainty due to inflation, rising interest rates, and banking troubles eroded investor confidence. Overall (across segments), the number of deals declined more than 15% globally since 2021, with the biggest decline in Asia-Pacific and significant deal activity reduction in EMEA and the Americas.
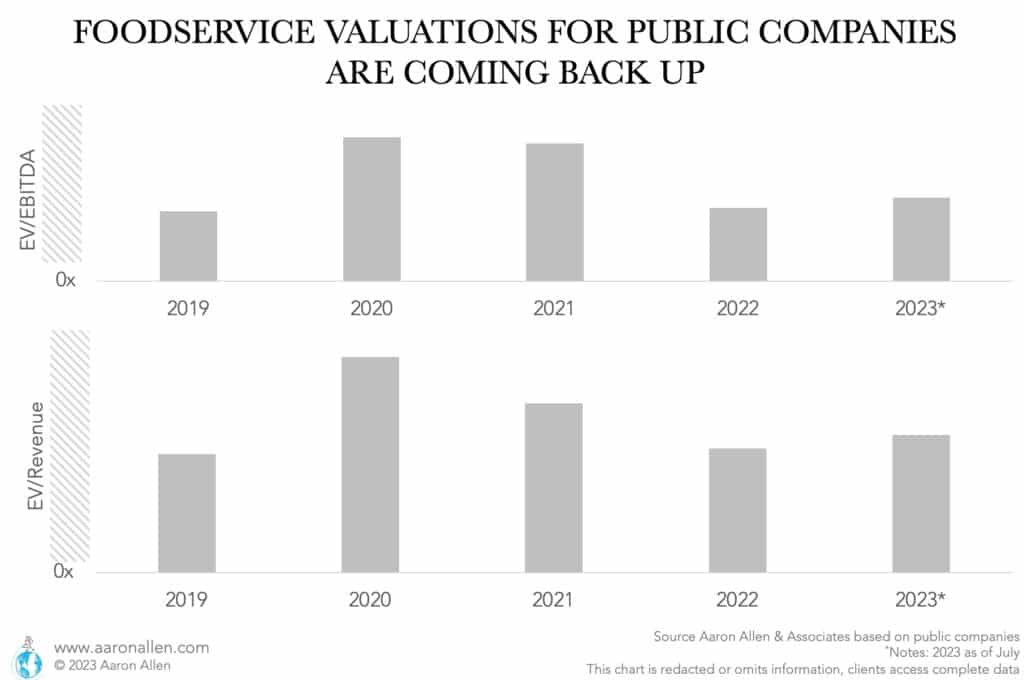
During the pandemic, valuation ratios were maintained artificially high. In 2022 they started to go back to pre-pandemic levels, but valuations for public companies in the U.S. have climbed back up in the first half of 2023.
However, valuation ratios are not all that matters at the moment of a restaurant chain acquisition. The definition of a Normalized EBITDA was shaken by the pandemic, and this affects the enterprise value as much as the valuation ratio. At the same time, the trends that will impact sales and costs affecting margins have a different dynamic post-pandemic that needs to be analyzed with due diligence to reduce the risk inherent in the assumptions that go into valuation models.
Foodservice Valuation Multiples Are Bolstered by Healthy Investment Activity
Mergers and acquisitions activity has been relatively robust, spurred by the drivers of a healthy deal-making environment, like high equity markets, investor confidence, and favorable credit markets. For an investment banker or someone trying to sell a restaurant company, high multiples provide a basis for pricing a business at a premium while lower multiples offer a filter to find assets that might be undervalued.
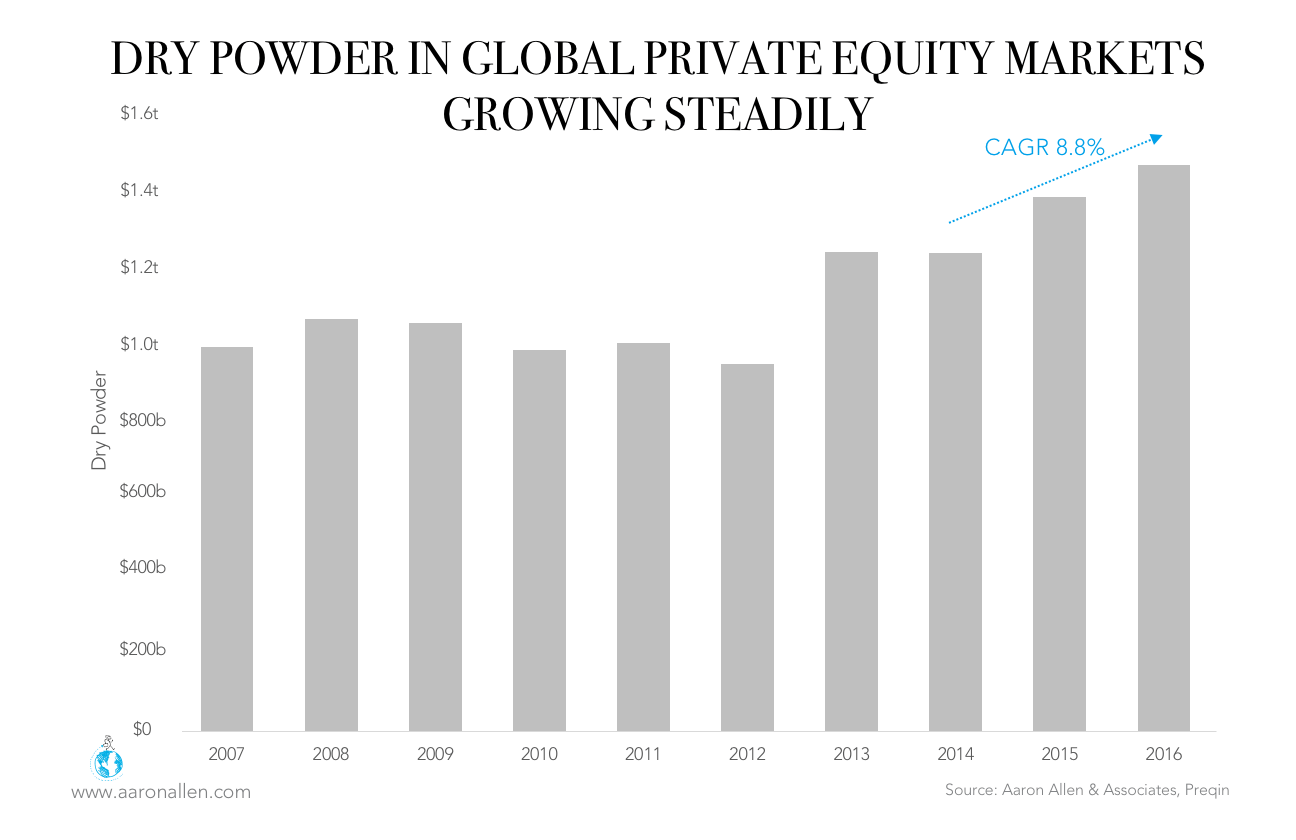
Global reserves of private equity funds continue to increase, reaching a record high of $2.5 trillion in 2019. The continued growth of dry powder (surpassing the $800 billion mark in 2021) has made investors anxious about finding investment prospects. We’ve seen a number of high multiples as a result of this dry powder.
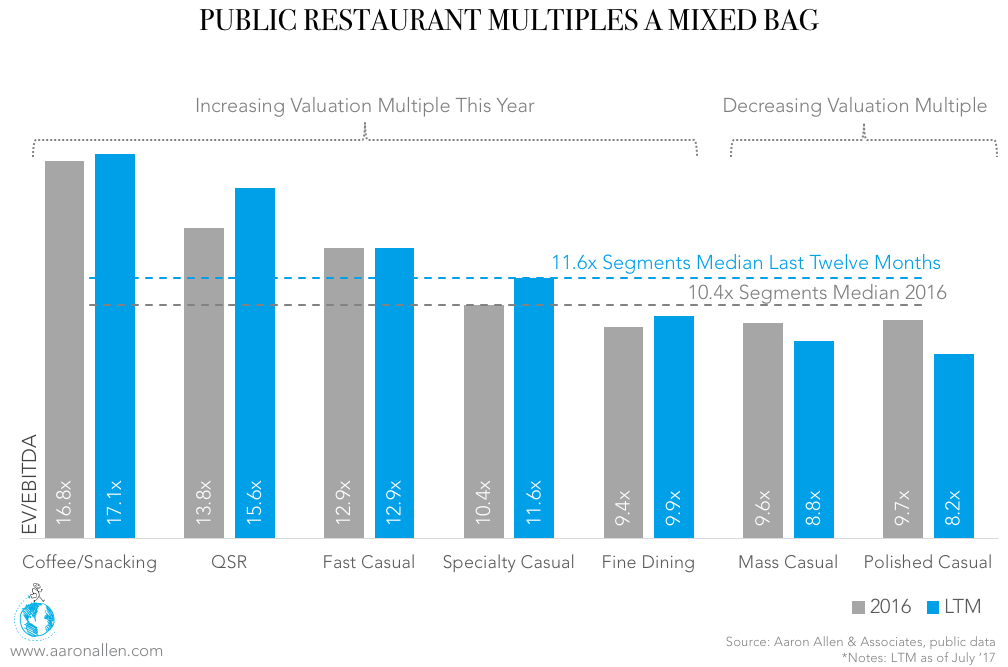
Investment in restaurants is starting to mirror the writing on the wall: investors are pulling back from Casual Dining chains and moving increasingly toward QSR — just as many diners have. Those with a unique concept in a growth market will be most likely to see investment; though this also means that valuations for many CDRs are lower, making for prime investment opportunities with the right turnaround plan (though this is obviously not true for all CDRs).
Regardless of the economic climate, there will be an opportunity in the foodservice space. If there’s a liquidity crisis, M&A opportunities will come through consolidation and distressed assets investment. If the economy is booming, emerging brands and markets will reveal new growth acquisition targets (38.6% of global M&A activity across all sectors features cross-border transactions already).
- On the sell-side, valuations are still high and it can be a good time to evaluate an exit.
- On the buy-side, it may be worth paying a premium in valuation multiples for the right platform (in high-growth geographies and segments) and incremental add-ons. A creative and modernized investment thesis, due diligence, and custom market landscape insights are requisite for an acquisition and expansion strategy that leapfrogs the competition.
Restaurant Valuations are Higher for Large Companies
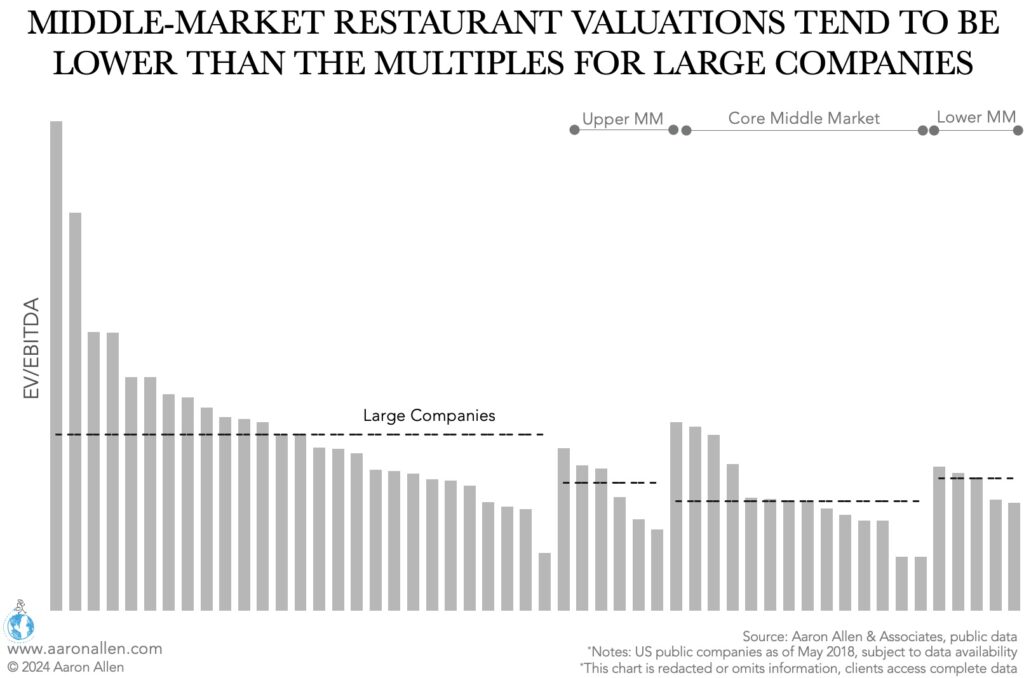
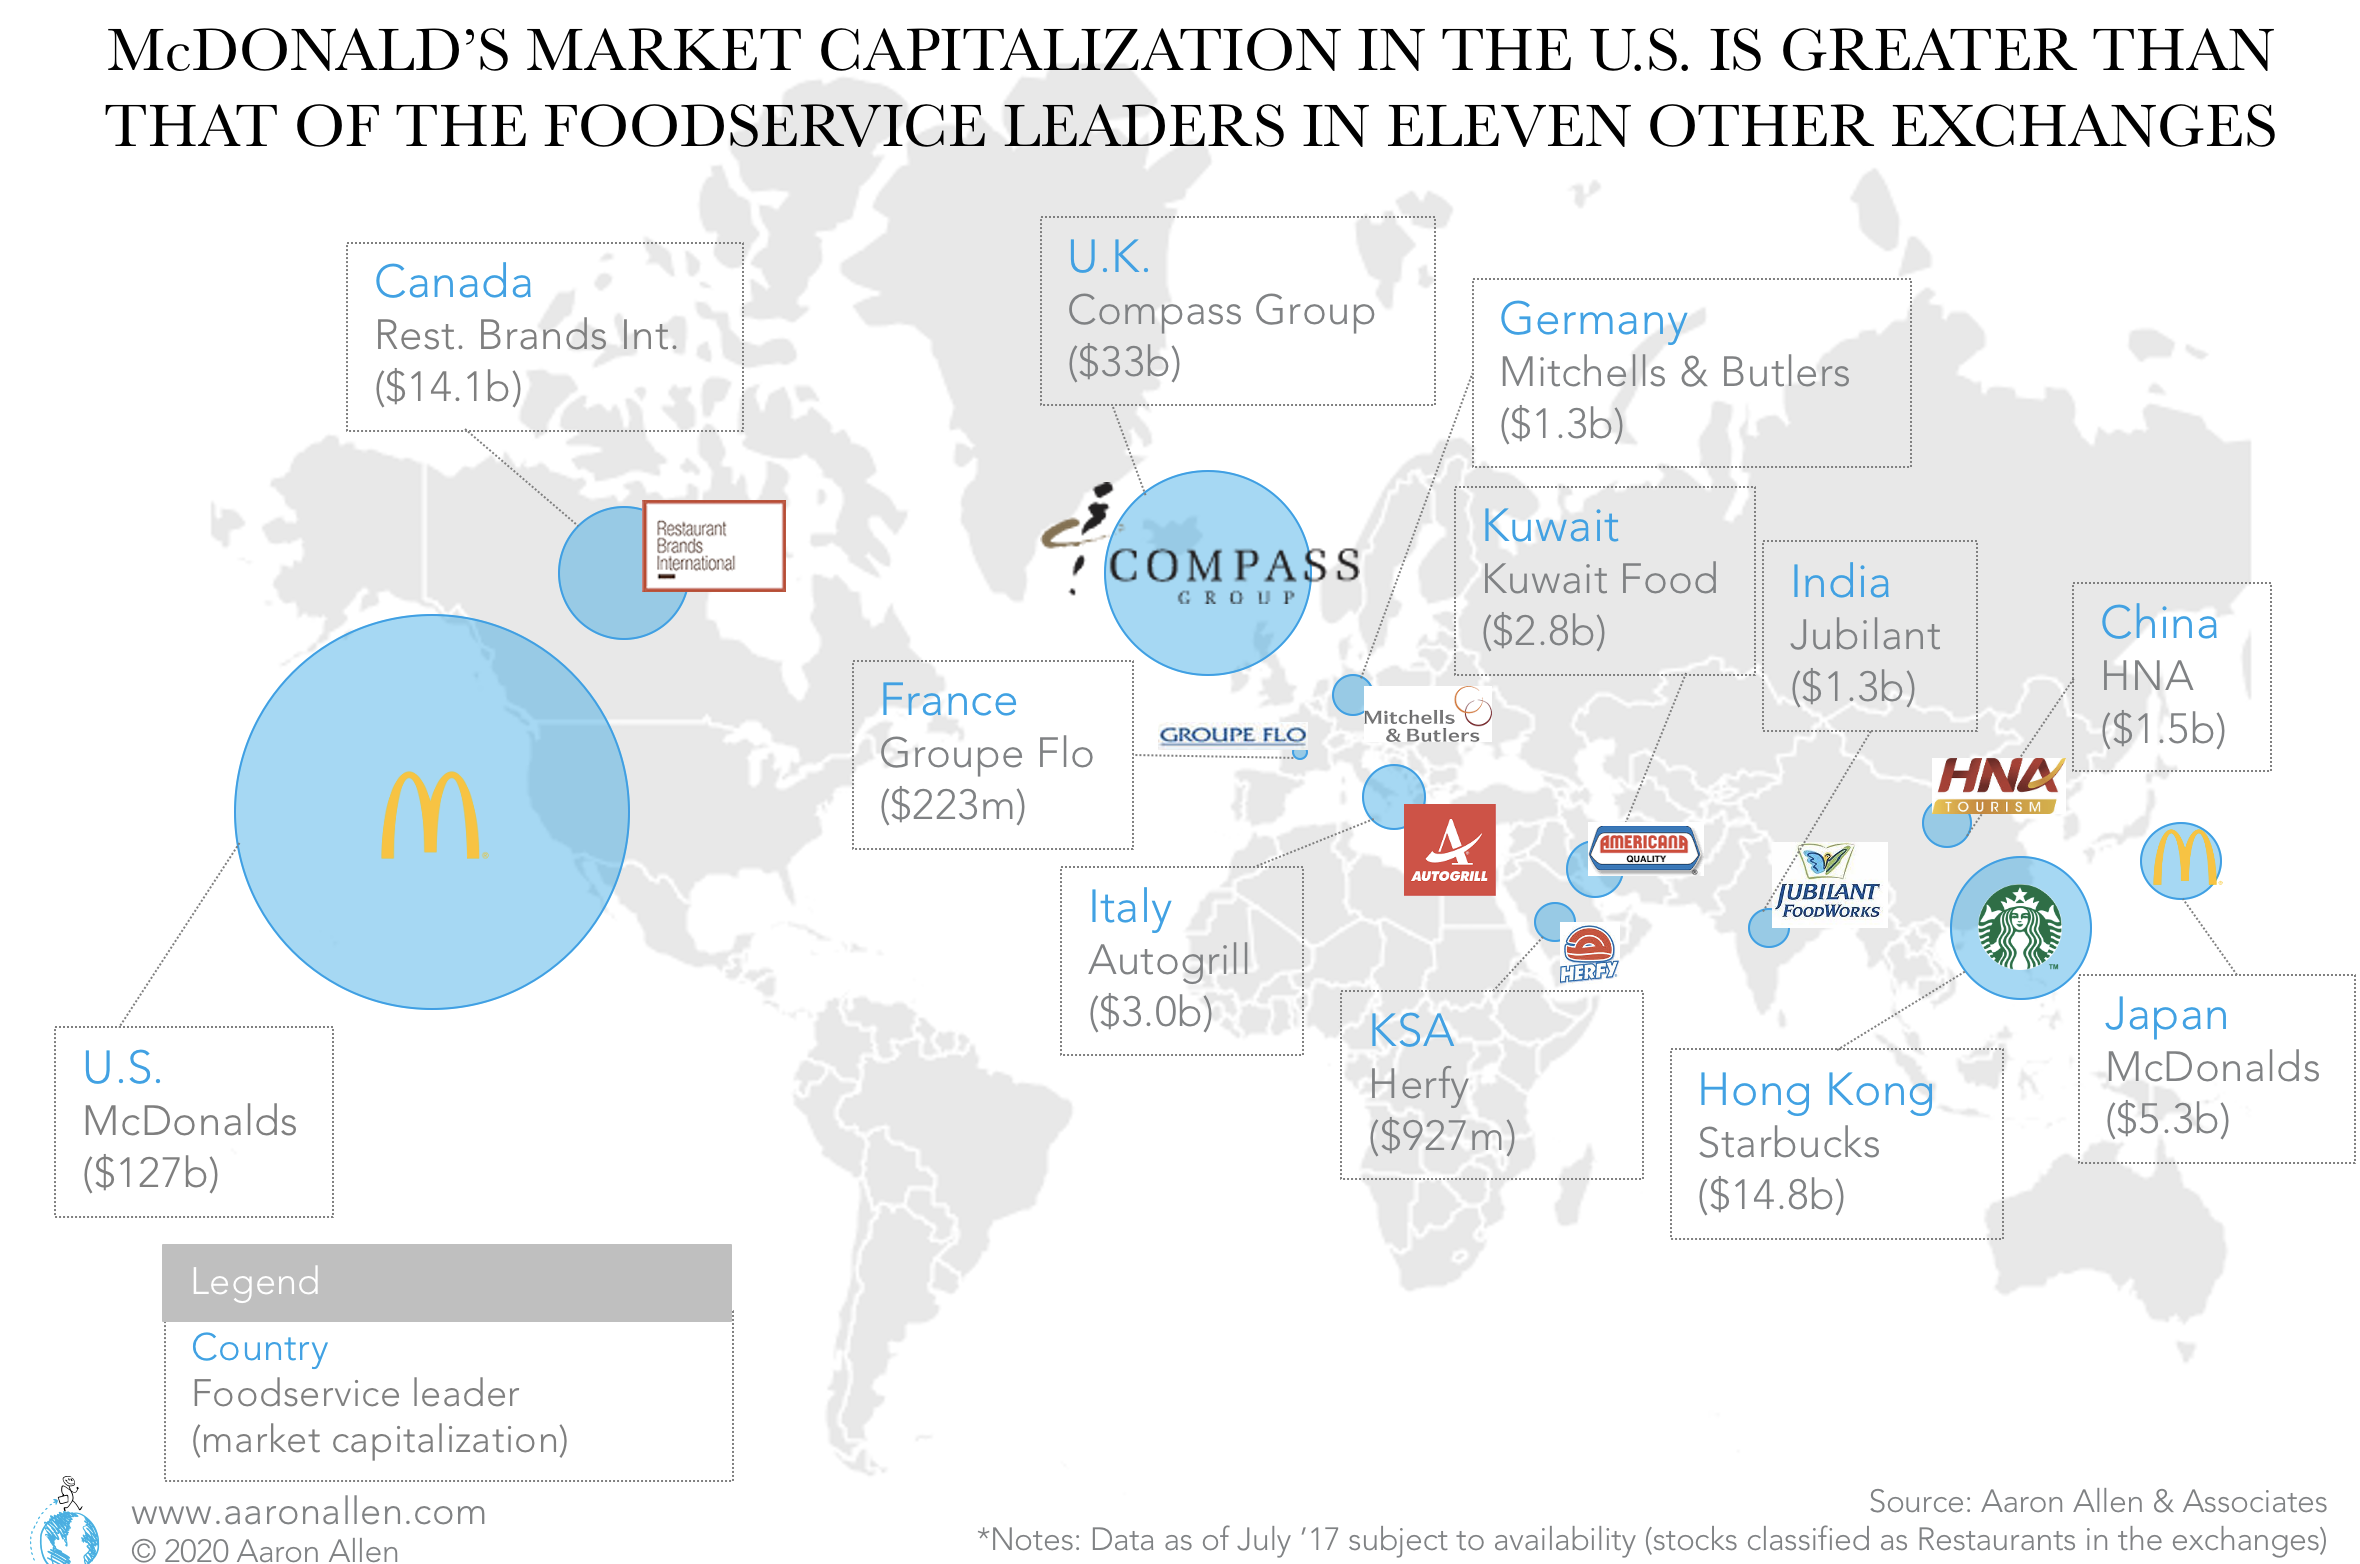
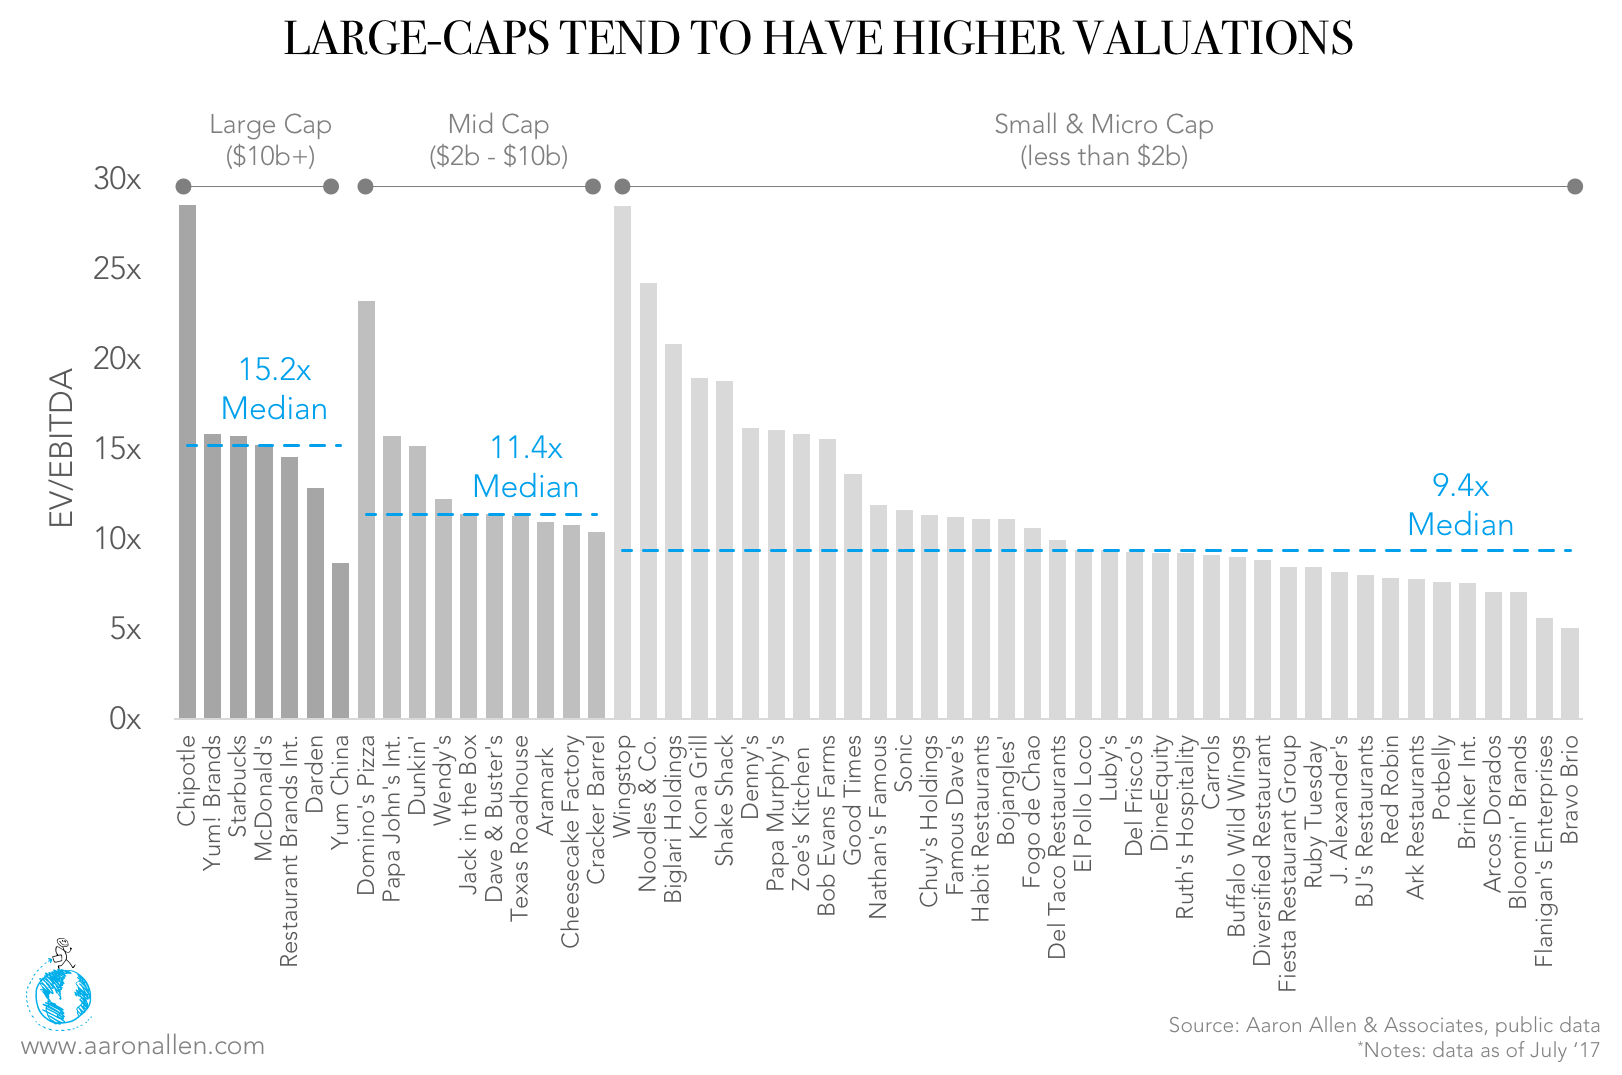
Among public foodservice companies in the U.S., large companies (those with more than $1b in enterprise value) tend to have higher valuations (13.5x the median) than middle-market chains (core middle-market restaurants have a 38% lower valuation). Some of the most prominent foodservice companies in the world also have a dominant presence on stock exchanges. The market cap of McDonald’s, for instance, is much greater than that of other large foodservice leaders in 11 other countries.
Restaurant Valuations are Higher for Quick-Service Operators
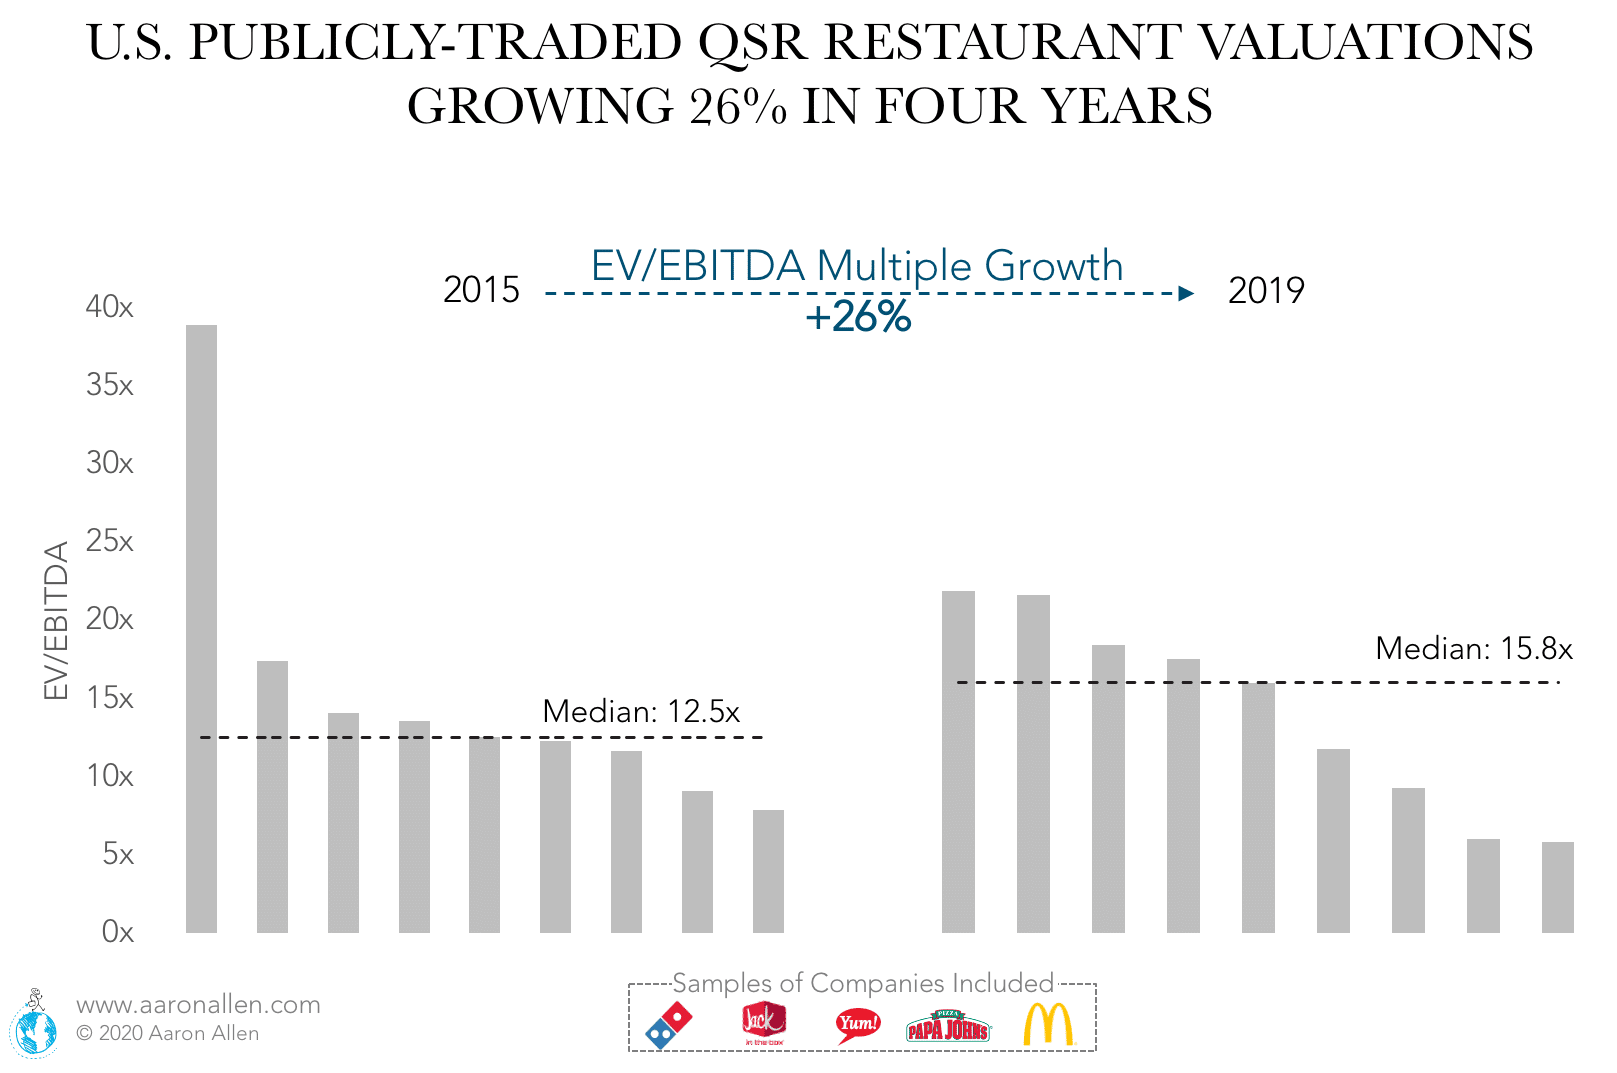
For more than ten years, the multiples for quick-service restaurants and fast-casual restaurants have been higher than that of casual dining restaurant chains. As of 2019, the valuation multiple for QSRs was more than a third higher than the fast-casual median and about 60% higher than the multiple for casual dining restaurants.
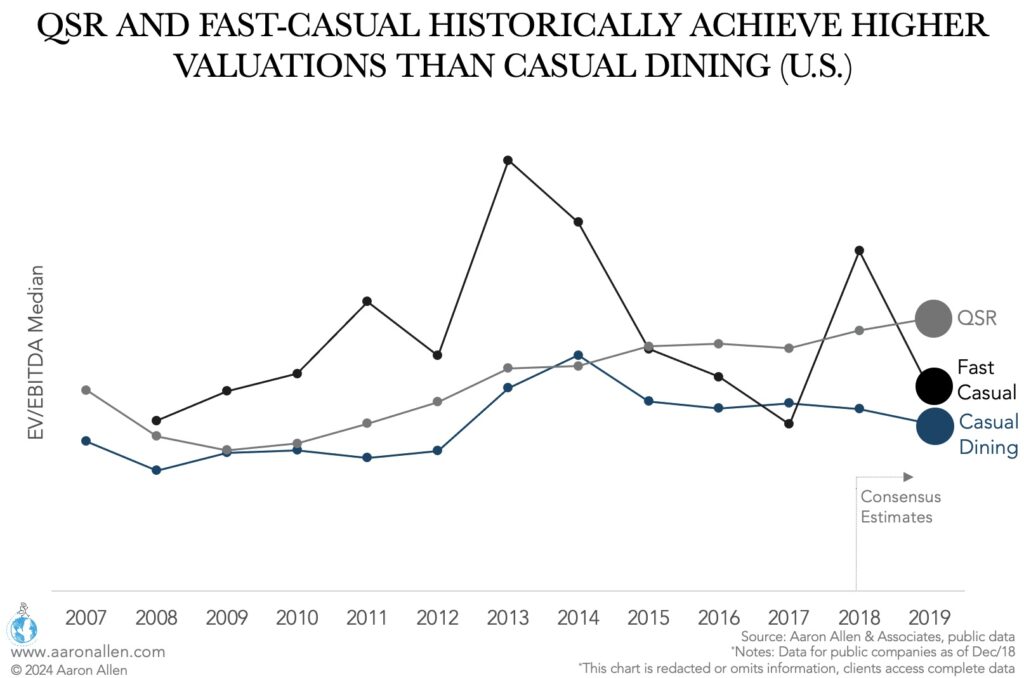
There is, however, a large variability within each service category. Among QSRs, Domino’s had a multiple of 20.0x, while the lowest was 5.8x for the Burger King franchisee Carrols. In QSR, pizza chains (like Domino’s) and coffee/snacks restaurants (like Starbucks) tend to have higher valuations than the average fast food chain.
Higher Valuations for Restaurant Franchisors
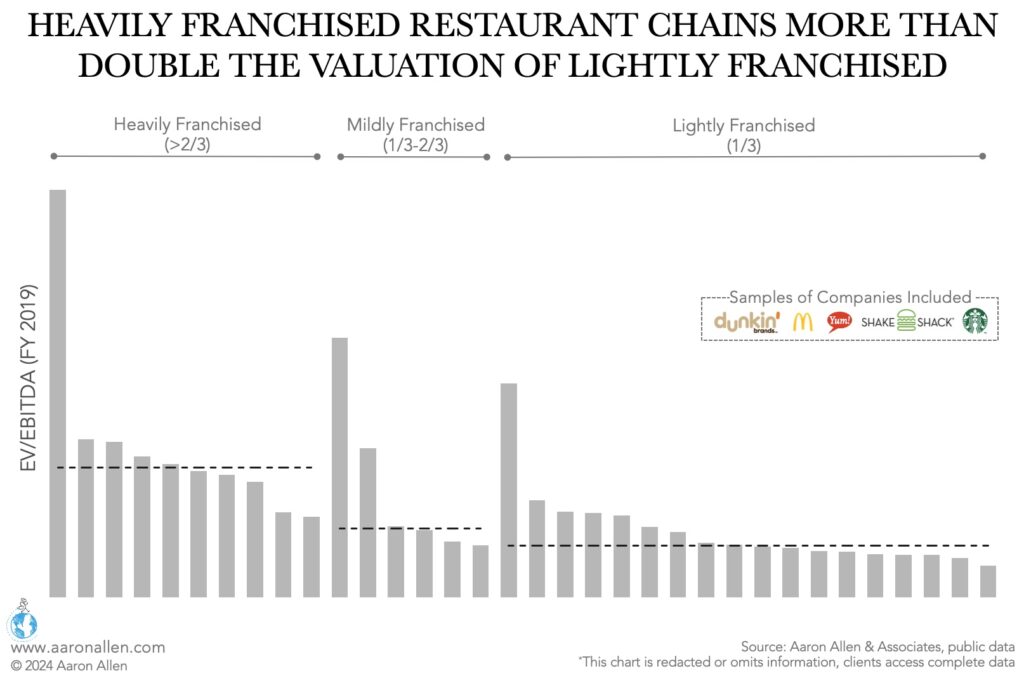
Among publicly traded foodservice companies in the U.S., highly franchised chains are reaching valuations that more than double (as a median) the EV/EBITDA multiple for lightly franchised chains. Many of these heavily franchised businesses operate in international markets via agreements with master franchisees. There is a strong case to be made for buying American restaurant chains and becoming the franchisor, rather than operating as a franchisee.
Restaurant Business Valuation: Trends Over Time
Historically speaking, valuations in the industry have increased significantly. In the last ten years, valuations measured in EV/EBITDA multiples increased by 44% for U.S. publicly traded companies from 2009 to 2019.
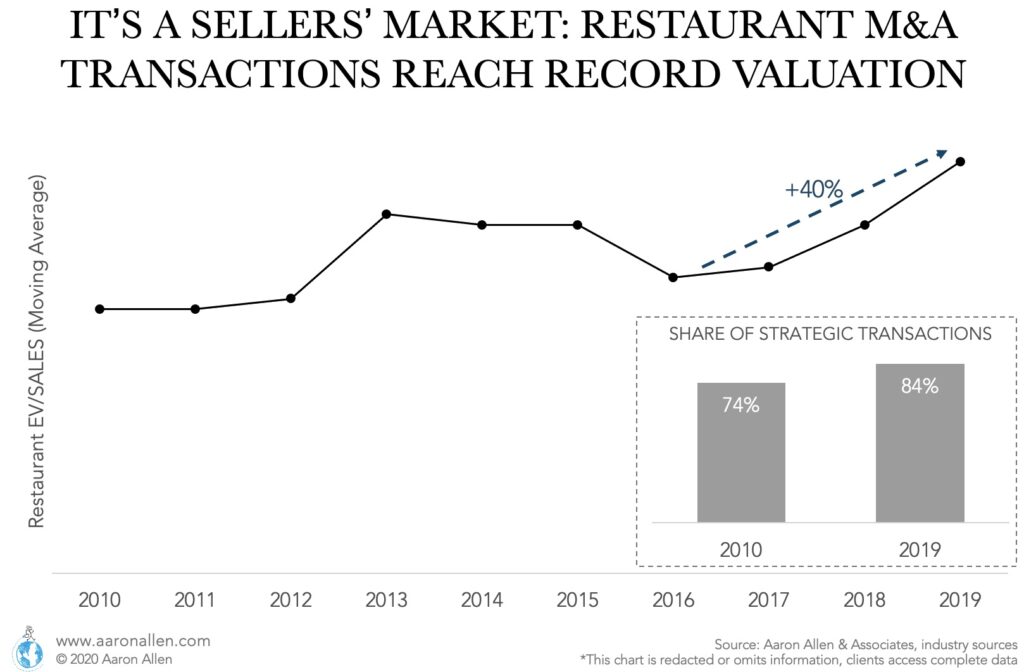
In terms of EV/Sales, the increase has been 40% in 2016-2019, including public and private foodservice companies (U.S.). While QSR and fast-casual restaurant chains have increased valuation the most, casual dining chains, in general, have grown at a more modest pace.
The pandemic caused global M&A activity to shift from a sellers’ market to a buyers’ market in just a few weeks (and then shift back). As the economy came to a halt and distressed assets started hitting the market, valuations came down considerably. In the U.S., restaurant EV/EBITDA ratios dropped by more than 20% in 2020. however, that’s not even half the drop seen after the Great Recession (and during the period, the restaurant industry wasn’t hit as hard as it was during COVID).
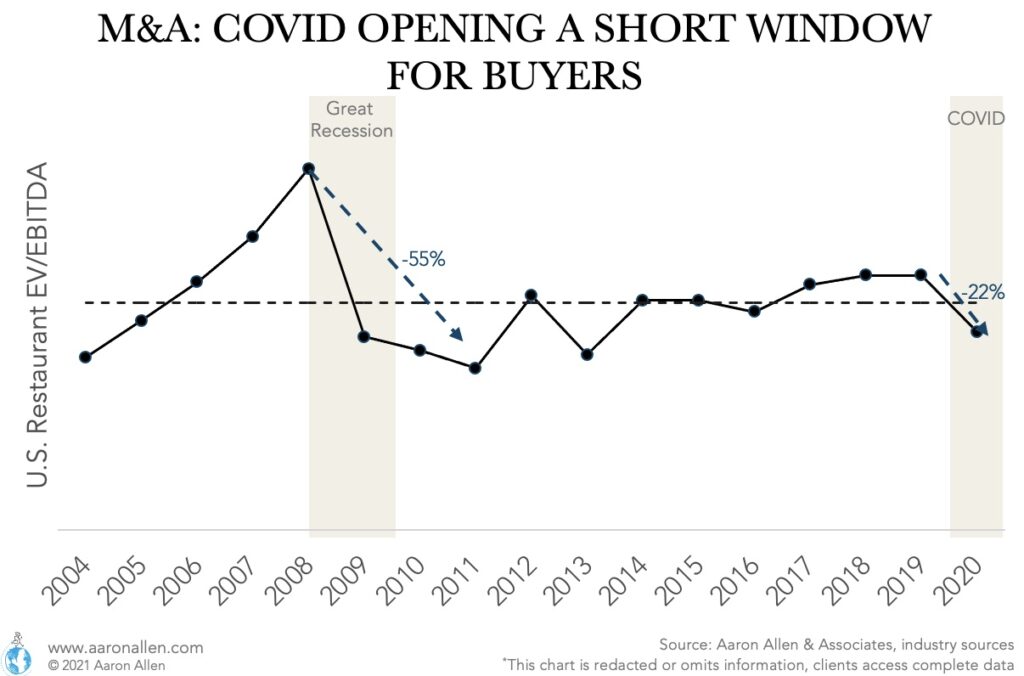
This indicated a resilience in valuations (which then climbed significantly in 2021). And the recent records in global M&A activity support this point. The buyers’ market was short-lived.
Valuations for publicly traded foodservice companies are not following the same decline we see in private companies. Though on the surface this may seem like a positive sign, it’s more related to a decoupling of Enterprise Value and EBITDA growth. While for most restaurants EBITDA decreased as a result of the pandemic, Enterprise Value fails to adjust in the same amount (even moving in opposite directions for companies like Shake Shack, Noodles & Co., Chipotle, and Wingstop).
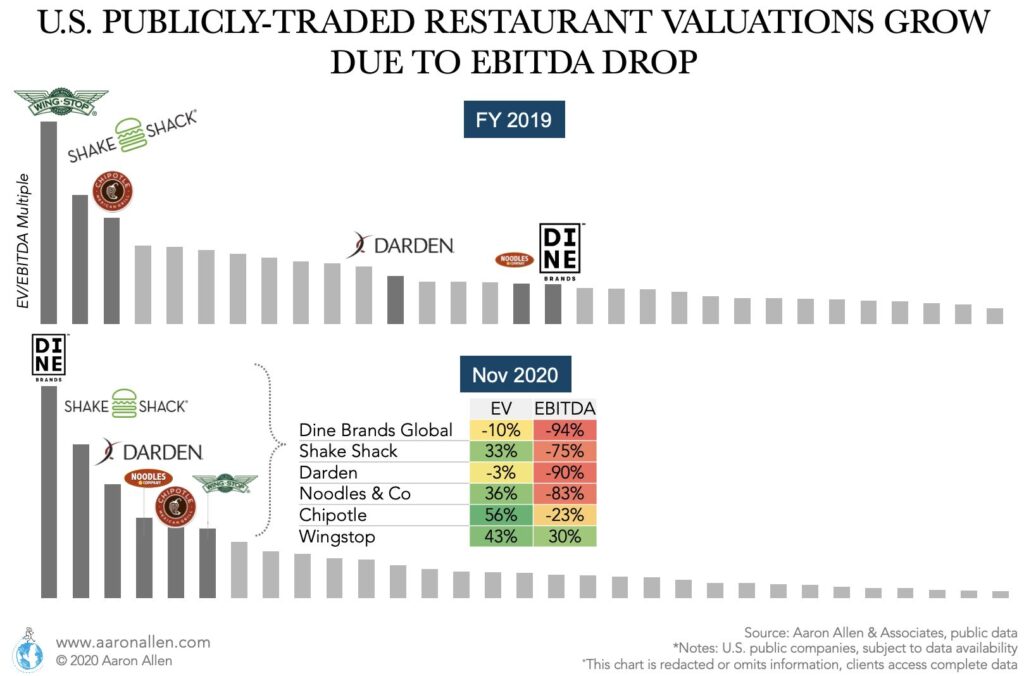
In some cases, investors are betting on long-term growth and formats/concepts that have thrived during the crisis, in many others recovery will be hard to obtain and EV will eventually come into line with performance metrics (including restaurant closures and thinner margins).
Pizza Restaurant Industry Valuation
Through the 1990s and early 2000s, publicly traded pizza companies generally traded in line with their peers with enterprise value/EBITDA (EV/EBITDA) multiples in the low-double-digits and price/earnings (P/E) multiples in the high-teens. However, in the mid-2000s, pizza chains were some of the earliest players in the restaurant industry to move more aggressively to a franchised structure, with Domino’s moving to 99%, Pizza Hut going to 95%, Papa John’s moving to north of 80% (in North America). With CAPEX responsibilities shifting more to franchisees, these chains took on more debt—many moving to more than 5 times debt/EBITDA ratios — and using proceeds to buy back shares (thus increasing the ownership stake of existing shareholders).
During the Great Recession of 2008-2009, this strategy worked against the publicly traded pizza chains and investors became more concerned about their high leverage positions. While the entire restaurant industry traded down amid concerns about consumer spending, pizza chains like Domino’s were hit disproportionately hard with shares trading for a few dollars per share in some cases.
Restaurants recovered faster than other industries out of the 2008-2009 recession due to a combination of consumer stimulus packages, low interest rates (which allowed other restaurant franchisors to follow the pizza companies franchising and leverage playbook), and new approaches to value. By 2011, the pizza category was largely back to historical valuation multiples. However, as Domino’s and others accelerate their investment into digital ordering technologies—driving a rebound in transaction growth and franchisee returns—the market started rewarding many pizza operators with higher valuations because of their technology assets. Instead of EV/EBITDA and P/E multiples in the low-double-digits, it was not unheard of for pizza companies to trade at EV/EBITDA multiples in the high-teens and P/E multiples greater than 30 times or more.
Because pizza chains have generally remained ahead of the curve with respect to technology investments, the market has generally rewarded these chains with higher valuation premiums the past several years (especially as the coronavirus pandemic highlighted the importance of digital ordering and other delivery-focused technology assets).
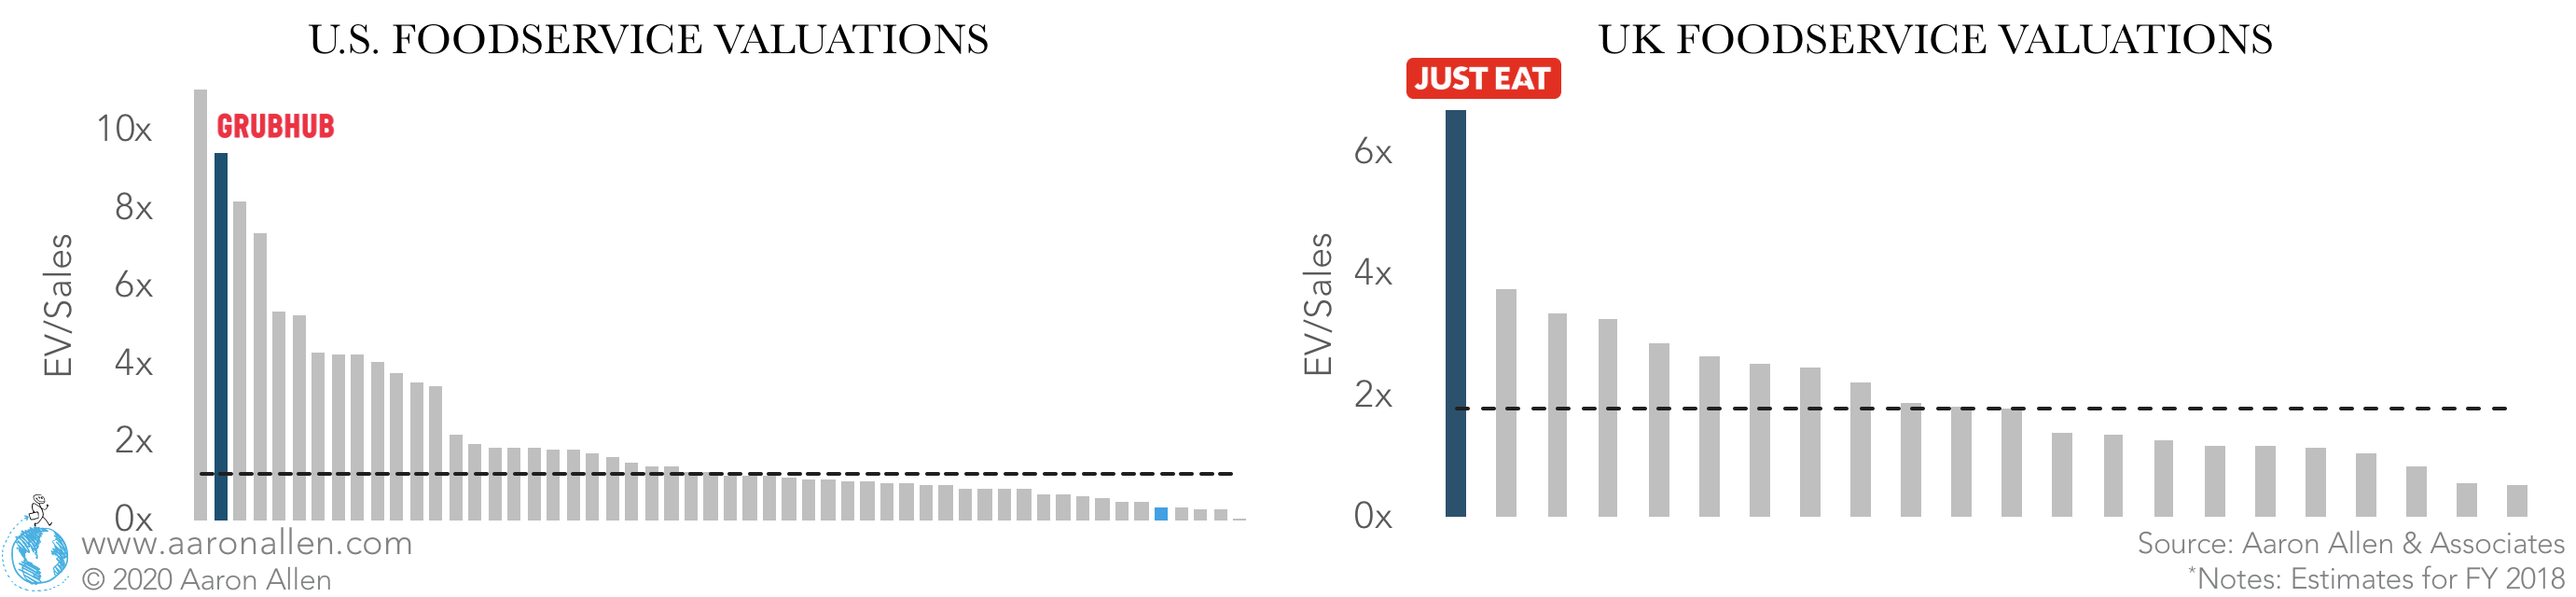
Food Delivery Company Valuations Comparing Favorably
Food delivery companies tend to be valued comparatively higher than restaurants and this is consistent across markets. In the U.S., Grubhub would be in the top-quartile valuation among publicly traded companies. In the UK, Just Eat was trading at 3.7 times the average EV/Sales for foodservice companies.
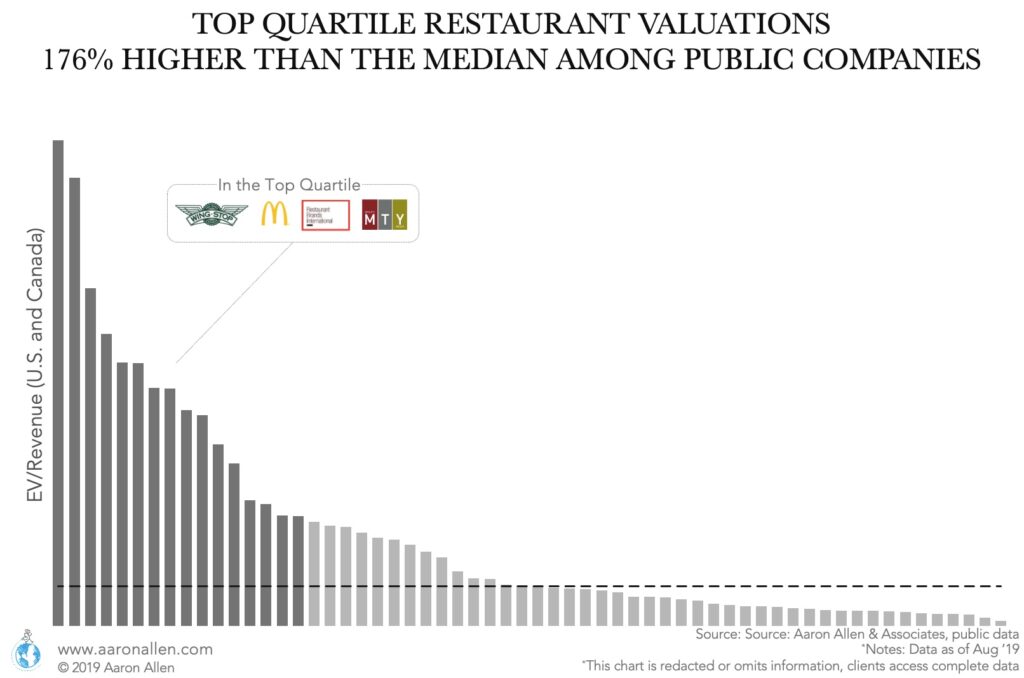
Commonalities of High Restaurant Valuations
Top-quartile performers can be valued many times the average market valuation. In the U.S. and Canada, the top-quartile is valued at a 176% higher multiple than the median.
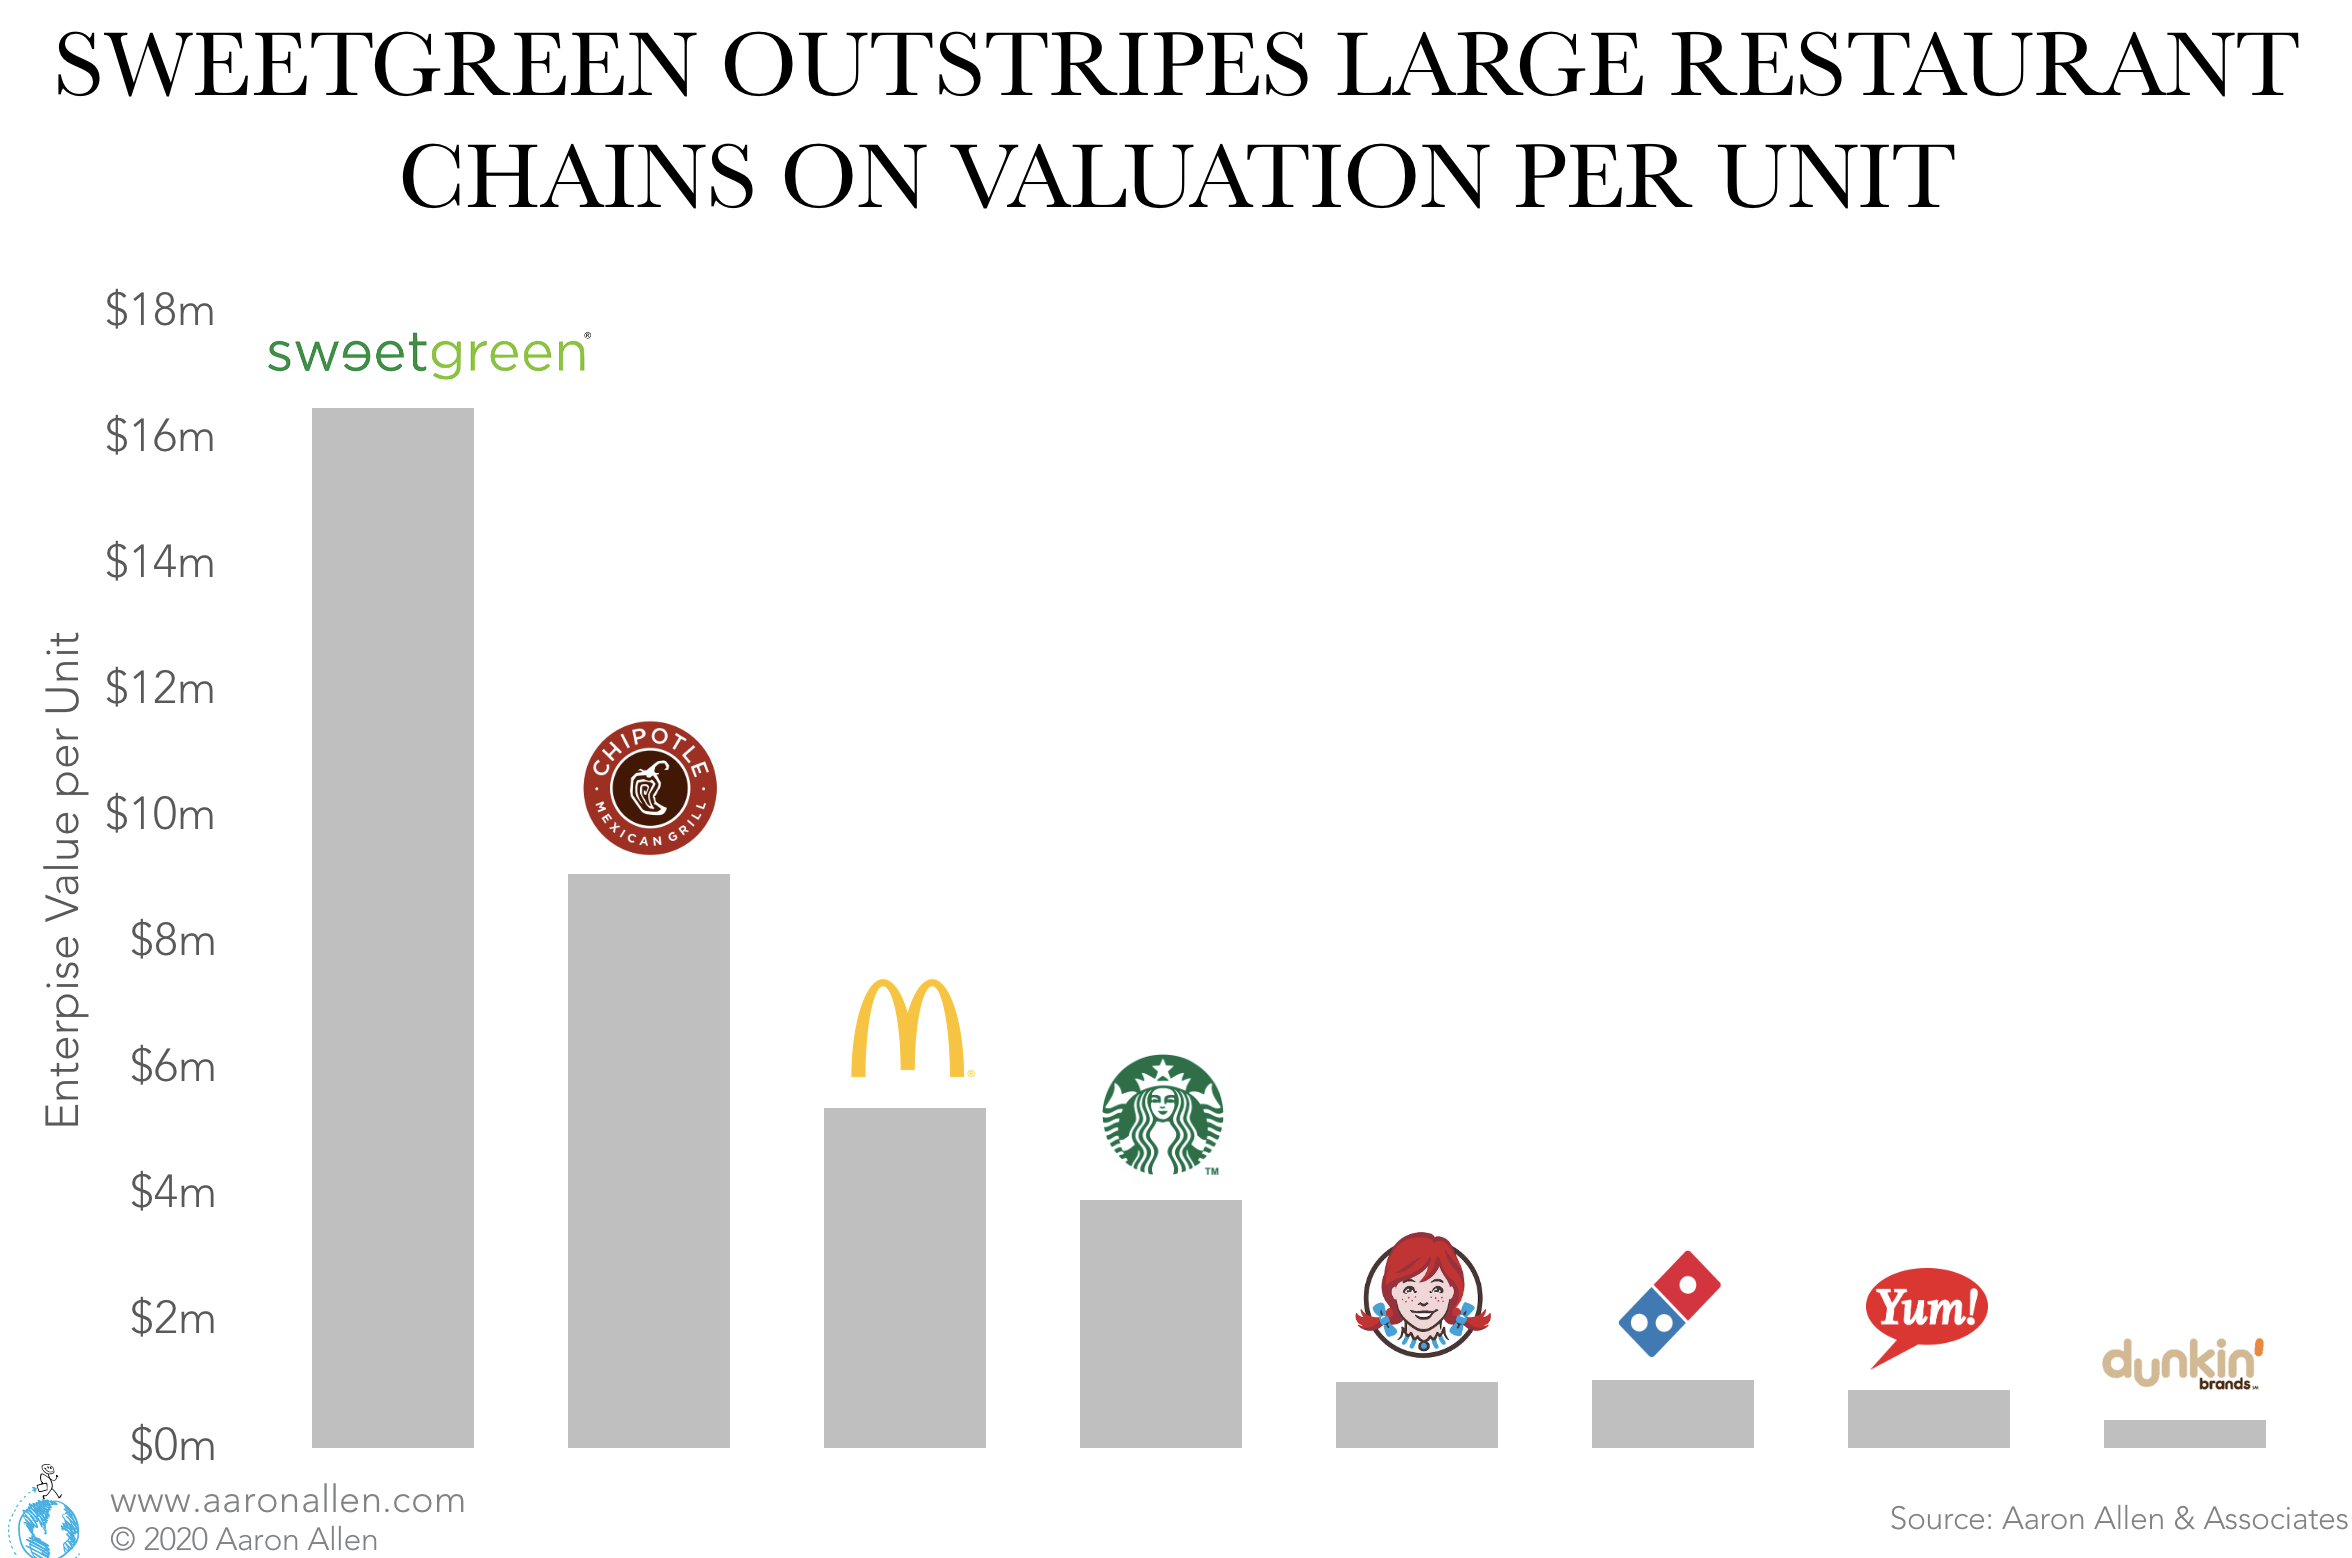
There are different reasons why valuations for some companies can reach such high values:
- In September of 2019, Sweetgreen closed a $150 million funding round earning a valuation of $1.6 billion. This puts their enterprise value per unit at about $16.5m per store — close to 81% higher than that of Chipotle, and more than three times the value per unit of McDonald’s. Alignment with consumer demand (and purpose) has been key to unlock such a high value.
- In many cases, valuation multiples are partially generated through a brand’s story. Shake Shack shares trade at a valuation of 22 times enterprise value to 2019 EBITDA.
- Among U.S. publicly traded restaurants, the companies with the best public image are in the top quartile of valuations (measured by EV/EBITDA). Chipotle, Shake Shack, and Starbucks are leaders with regard to purpose-driven brands, and Domino’s is at the foodservice technology frontier. Each of these companies also benefit heavily from earned media.
Restaurant companies that are growing fast and consistently are rewarded with favorable valuations. Growth CAGRs higher than 11% (over a 3-year period) get a median EV/EBITDA multiple almost 5x higher than the median for companies growing below that pace (considering U.S. publicly traded companies).
Restaurant Valuation Multiples Around the Globe
The below map shows valuations for some of the biggest foodservice companies in the globe. HNA-Caissa Travel Group, listed in the Shenzhen Stock Exchange, has the highest valuation , while on the other extreme Italian-based Autogrill has a valuation ratio on the lower end (as of 2017).
For the restaurant industry, U.S. multiples are 5.5% above the global average, only surpassed by India, which has valuations 21% higher than the US. It’s especially noteworthy considering 25% of the world restaurant & dining public companies are in the U.S., while only 2% are in India.
Valuations for Indian foodservice companies are 42% above the market average for that country. Similarly, Japanese foodservice companies have an EV/EBITDA ratio 30% higher than the market average (excluding financial companies). On the other hand, foodservice companies in China have a valuation ratio 35% lower than the market average.
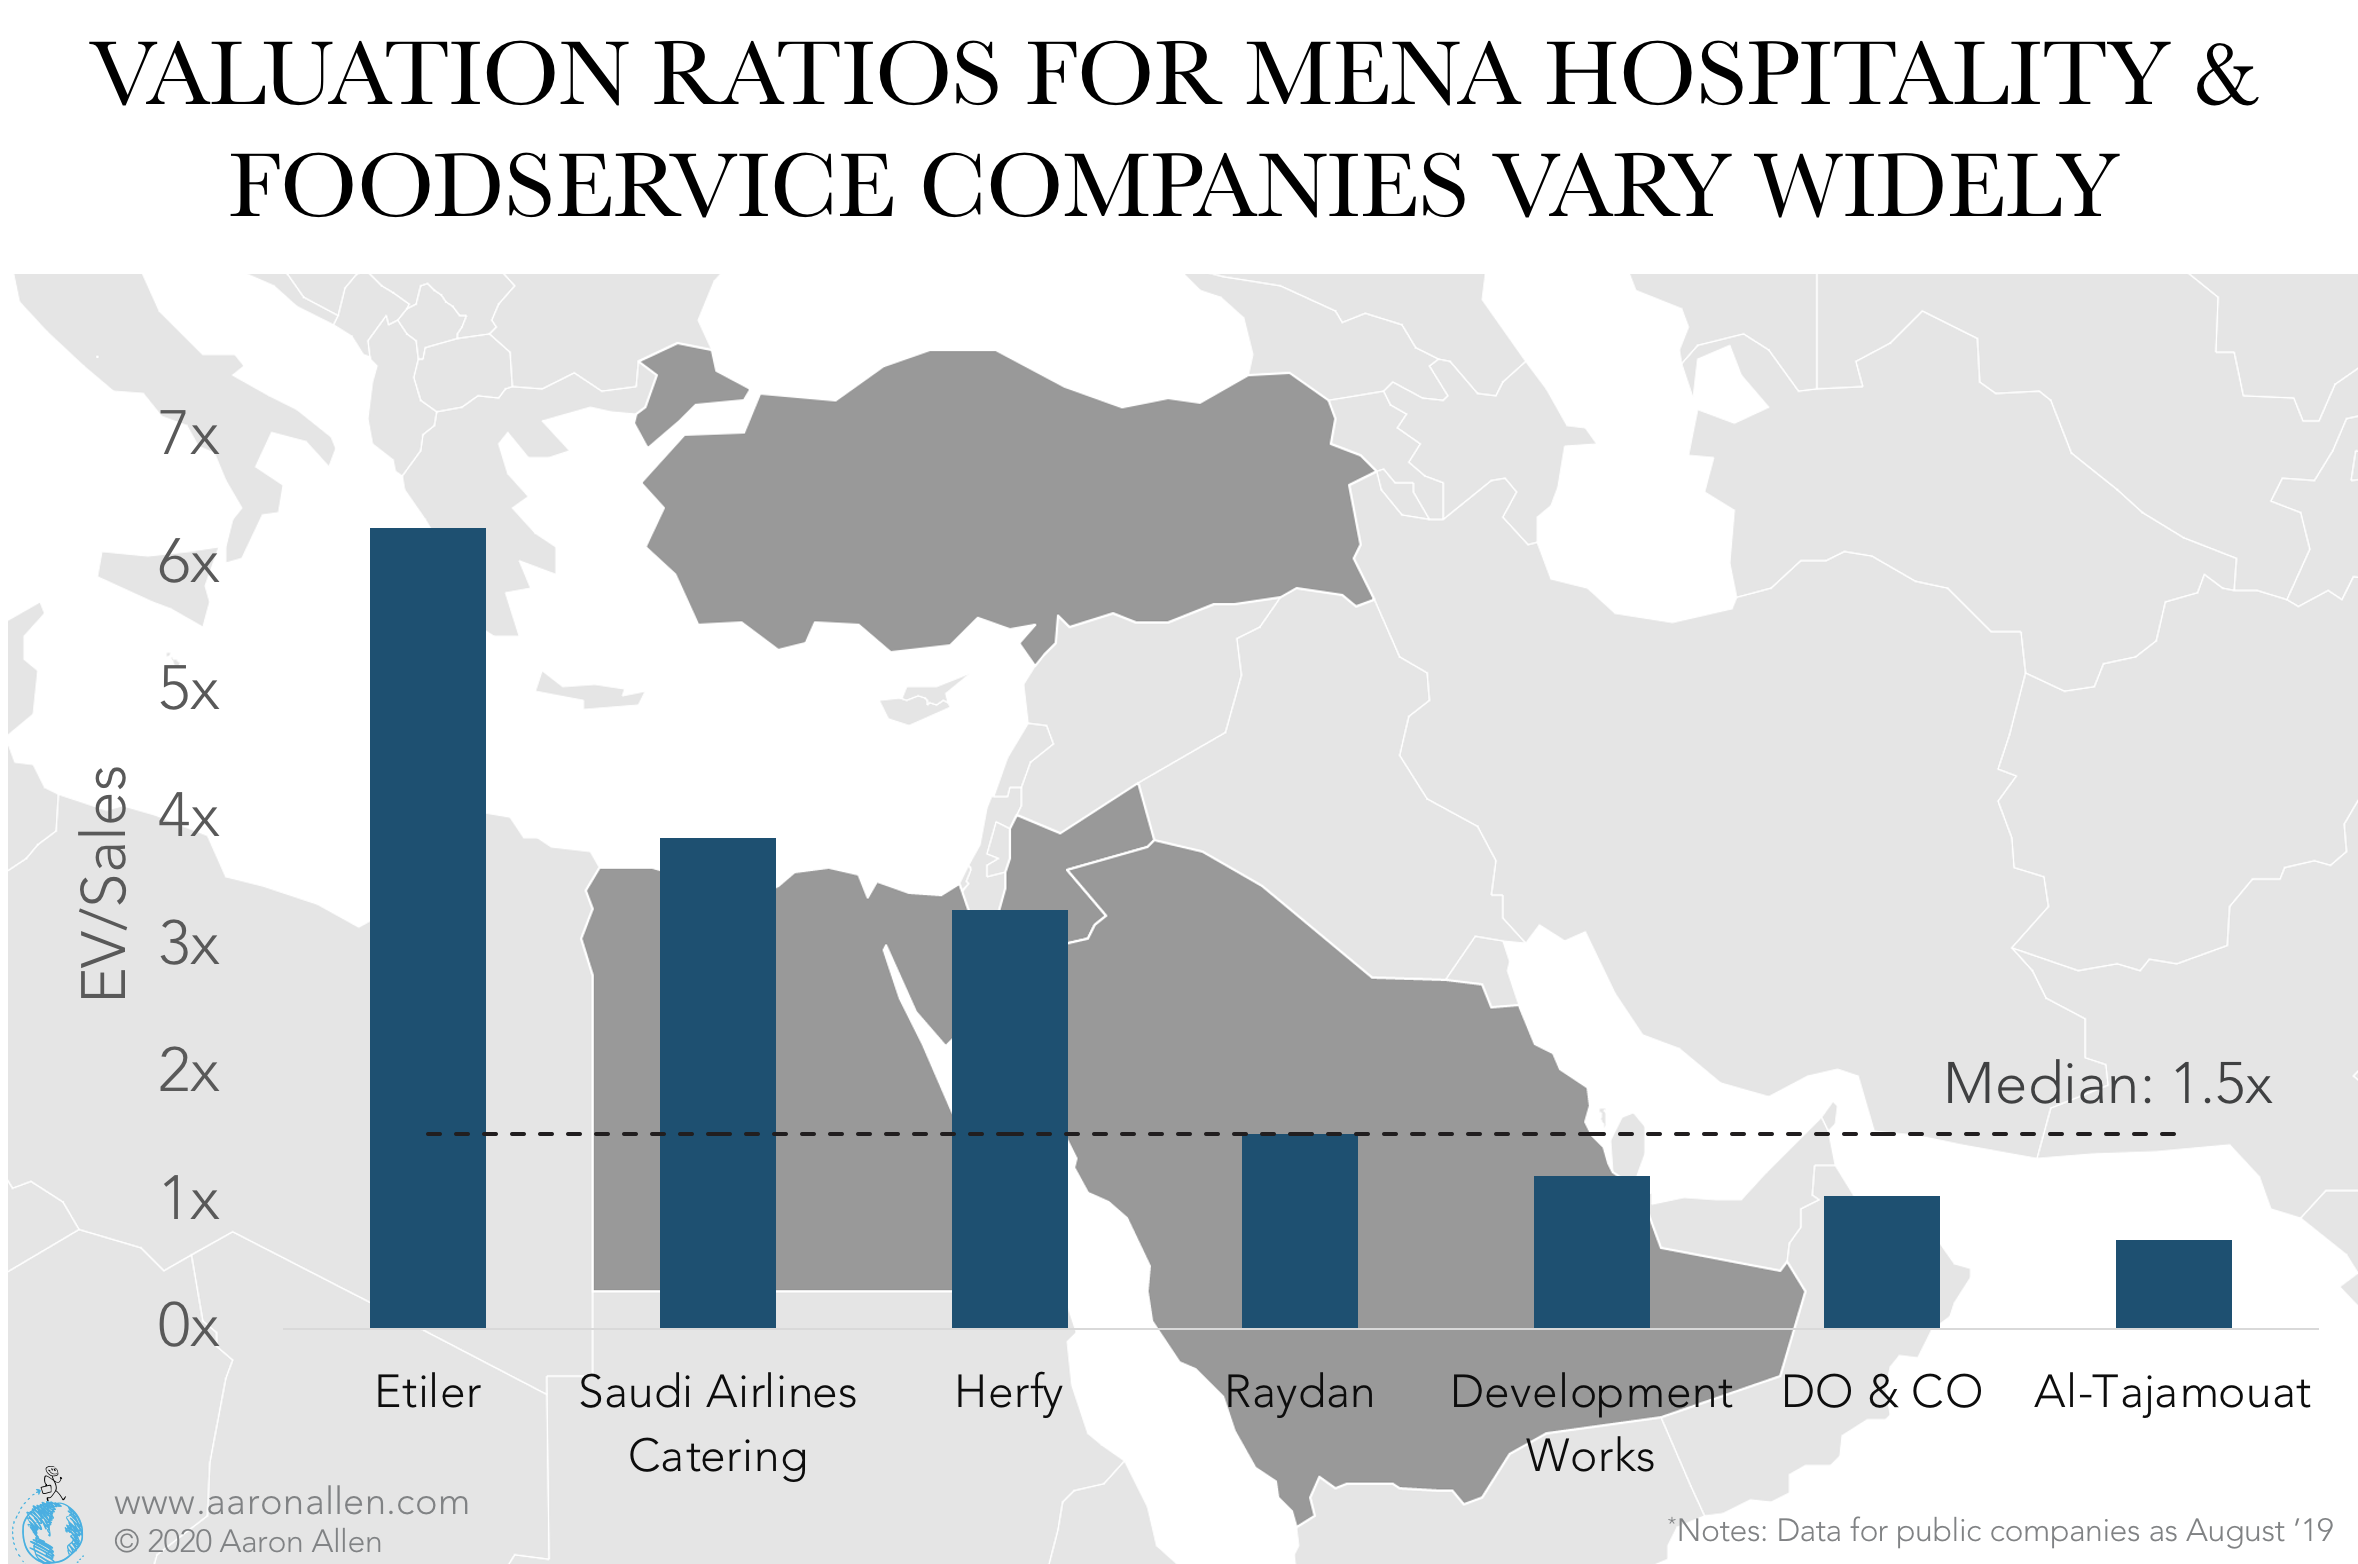
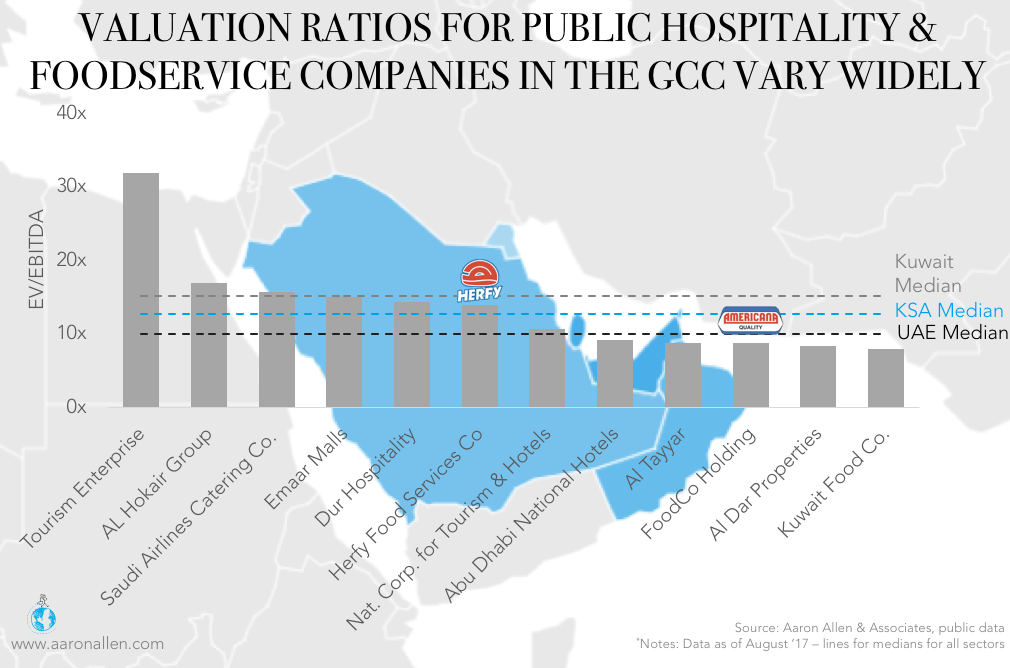
Foodservice Valuations in the Middle East
Valuation multiples for hospitality and related public companies in the MENA region can vary significantly. On the one hand, companies like Etiler (Turkey fast food operator) and Saudi Airlines Catering have EV/sales multiples considerably higher than the median. Alternatively, DO & CO (Turkey — restaurant, cafes, airports, gastronomy) and Al-Tajamouat (Jordan — catering and other services) are well below the median valuation for their respective markets.
With only a handful of public restaurant companies in the Middle East, comparisons turn to the broader “Consumer Cyclicals” segment when a market approach of comparable companies is used to value a restaurant chain. For EV/Sales, valuation multiples in the Middle East are close to four times those of the U.S. (when comparing the median).
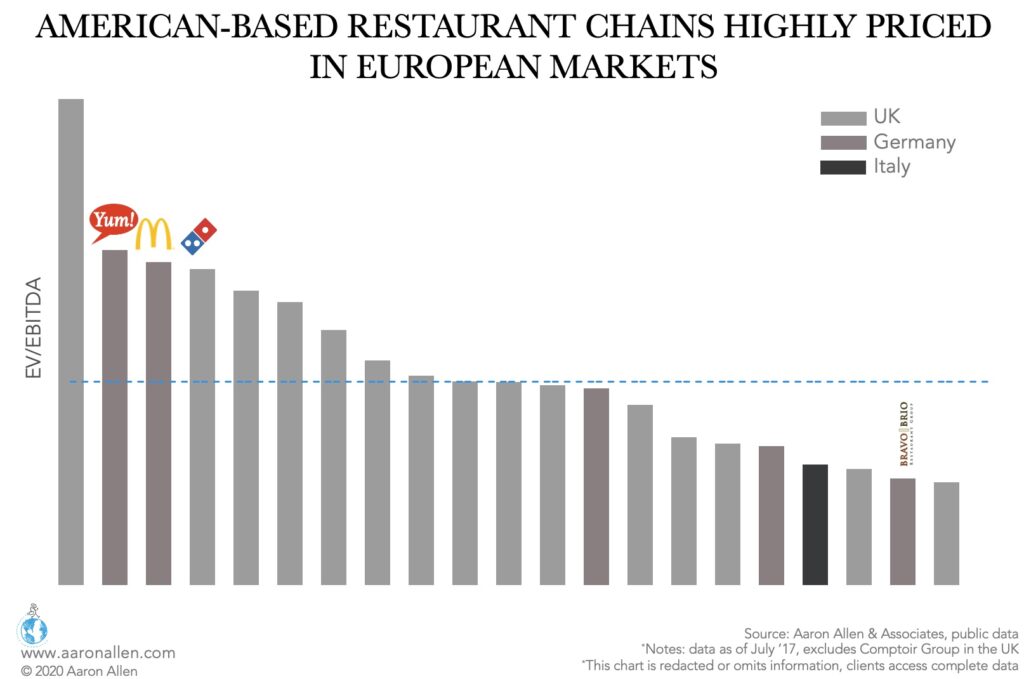
Restaurant Valuations in Europe
Among foodservice public companies in some of the most important markets in Europe, American-based companies (like Yum! Brands, McDonald’s, and Domino’s Pizza) have some of the highest EV/EBITDA multiples. On the other end of the spectrum, Restaurant Group, Bravo Brio, and Punch Tavern have the lowest valuation ratios.
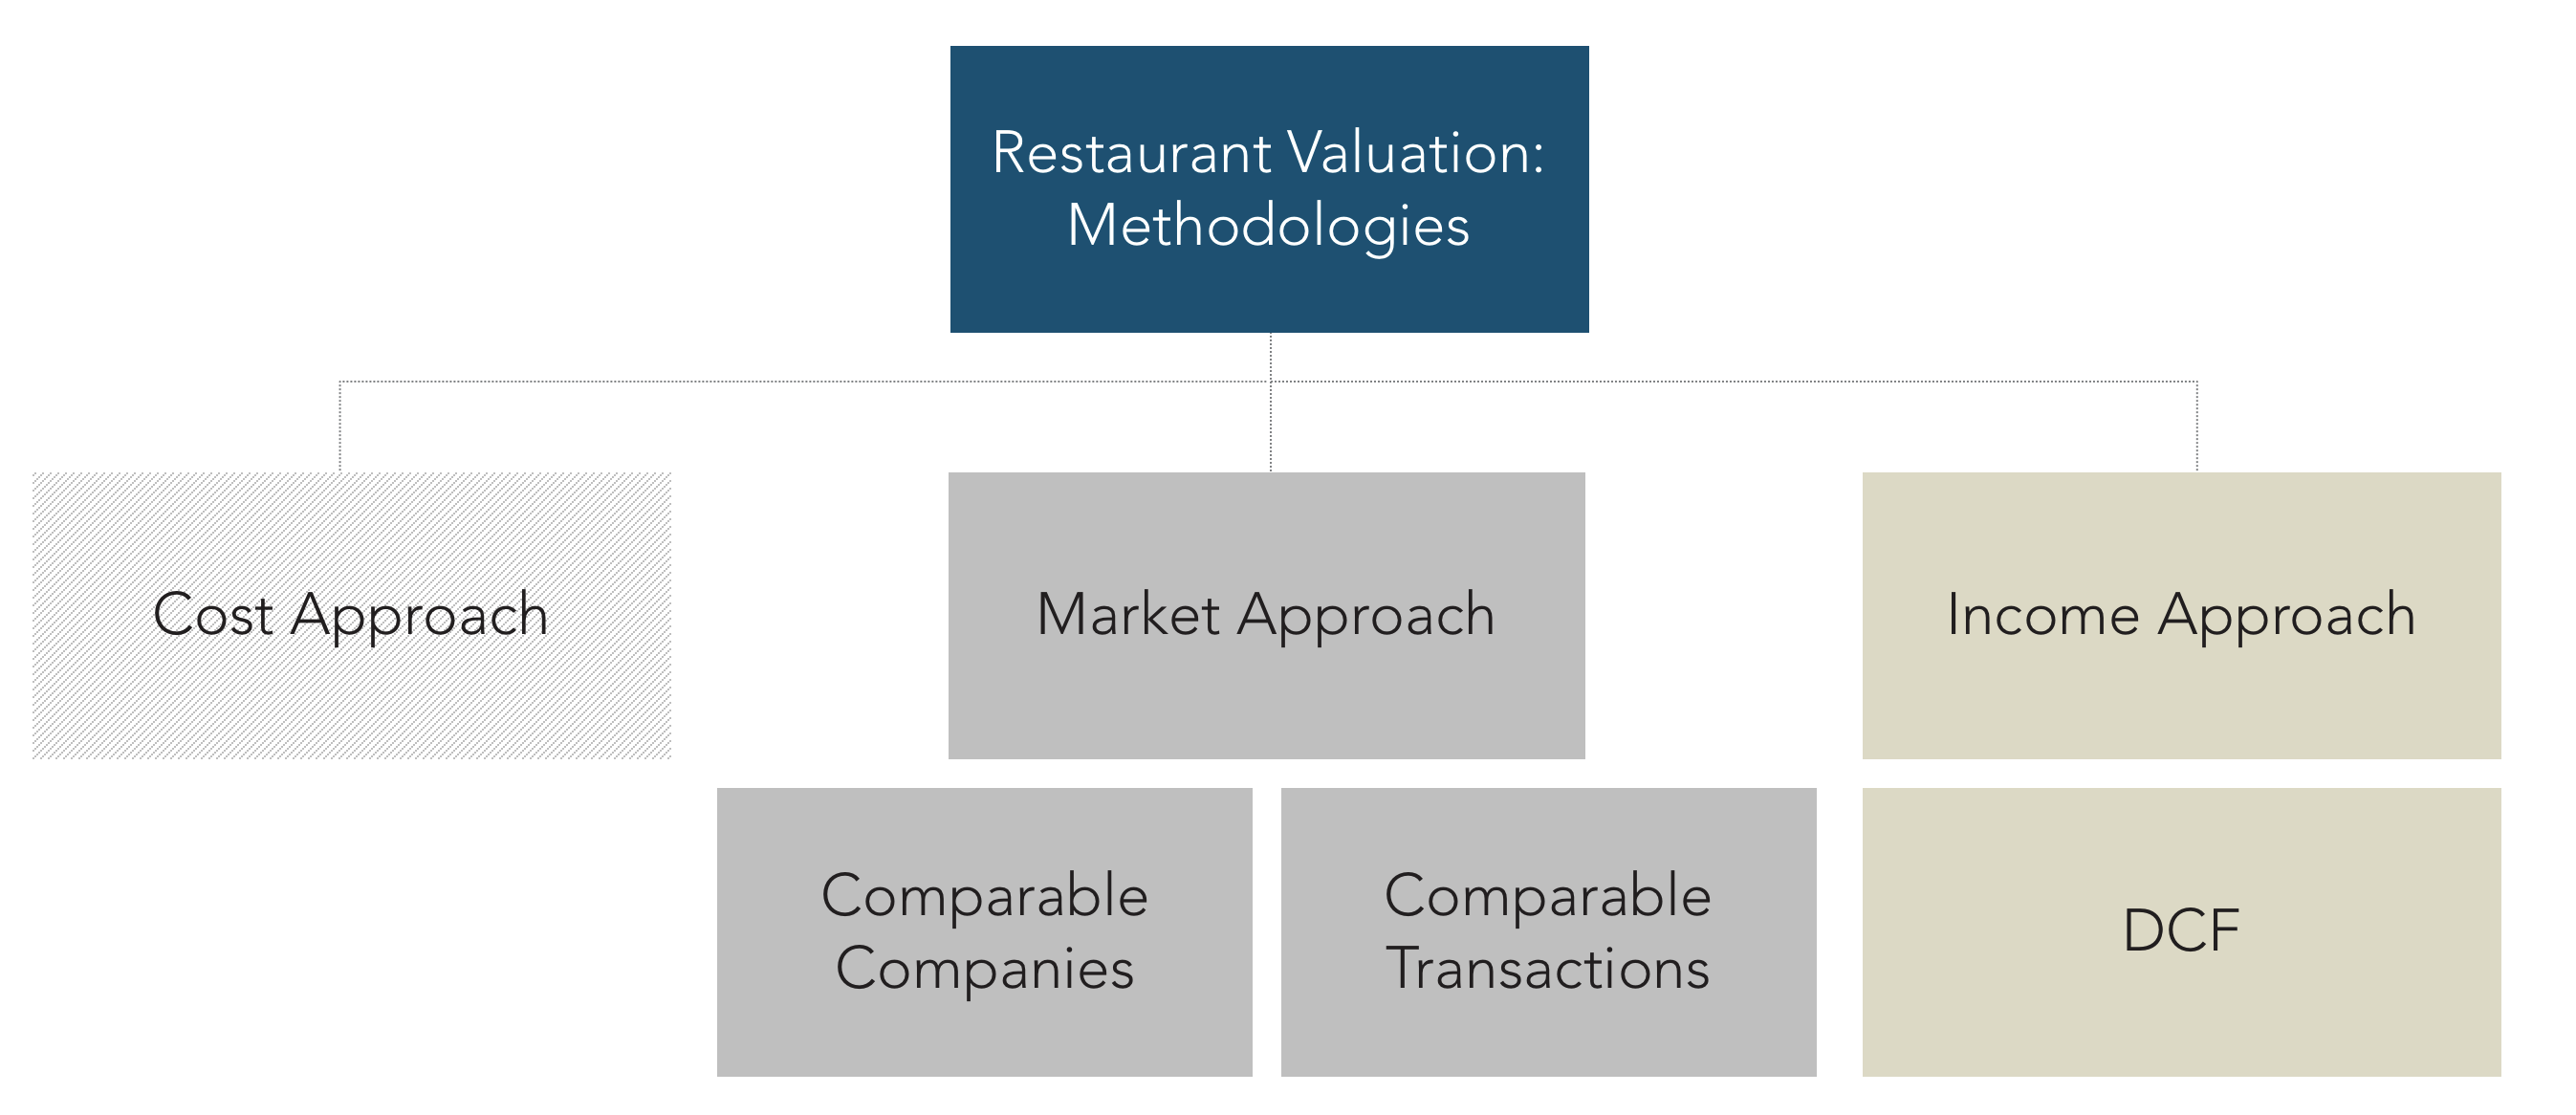
How to Value a Restaurant: Restaurant Valuation Methods and Methodologies
There are three valuation methods employed widely across different types of businesses: the cost approach, market approach, and discounted cash flow.
- Cost Approach to Value a Restaurant: This methodology is mostly employed in real estate, considering that the price for selling the business should equal the replacement cost (what would it cost to build this business starting from scratch). This technique is not widely used in the restaurant industry but would consider the market value of assets (like restaurant locations, warehousing, commissaries) and intellectual property and intangible assets (value of the brand, cost of setting up standard operating procedures, etc.) minus any debt. This is a more common approach in bankruptcy acquisitions, and an appraiser may need to participate in the asset valuation in that case.
- Market Approach to Value a Restaurant: in this valuation method, the value for the restaurant is derived from comparisons to other companies or transactions, this is considered a relative valuation methodology. The Comparable Analysis valuation methodology consists of comparing the restaurant to similar chains and applying those valuation multiples: EV/EBITDA (enterprise-value-to-EBITDA), EV/Sales (enterprise-value-to-sales), or P/E (price-to-earnings). Public restaurant chains are most often used as peers. In the case of Precedent Transactions, the comparison is done to similar foodservice operations that have been sold recently (either public or private companies). For independents, it is common to use a percentage of the annual operating income (25–40%). For a single, full-time owner, the operating income is the seller’s discretionary earnings (SDE), which includes profit after the owner’s salary and a few other expenses.
- Discounted Cash Flow Approach to Value a Restaurant: in this case, the company valuation for the restaurant is obtained by projecting the unlevered free cash flow of the business and discounting it using a WACC rate (weighted average cost of capital) to obtain the present value. The financial model to project future revenue should consider variables such as openings and closings and same-store sales growth projections to determine growth rates, probable labor cost increases, future earnings, and other top and bottom-line projections.
A range of values for the restaurant chain will be obtained from each valuation model and the expected valuation for the business will most likely be agreed upon in the intersection of the results.
The Future of Restaurant Valuation Multiples
Over the years, the average restaurant valuation multiple has slowly crept up. In the last few years, there have been some changes in the valuations of public companies across markets. The valuation ratio EV/EBITDA for emerging markets went from being the highest in 2013 to the lowest of all the regions considered by the end of 2016.
In the last two years, the rank of EV/EBITDA has been unaltered, with US restaurant companies on the high end and emerging markets in the low end of valuations.
The future that will prove favorable to the right bets: foodservice platforms with a high-growth potential, purpose-driven brands investing in mature and emerging markets, those that keep innovating and betting on convenience engineering, and those align with consumer trends on multiple fronts.
Restaurant valuation trends will continue to diverge depending on the segment. The long-term evolution of restaurant valuation multiples signifies that there are still bountiful opportunities for investors in the segment.
Frequently Asked Questions About Restaurant Valuations

Foodservice ESG Investments: Investing with Passion and Purpose
More and more investors are considering ROIs together with purpose. Socially responsible and impact investments represent 20% of assets under management in the U.S. as

Buy American Restaurant Chains
Buying American restaurant chains is becoming a hot topic among the inquires we receive from clients. And we’re not talking Patriotism, here. There are a

Earned Media: The Unsung Hero of a High Valuation
The launch of Shake Shack’s first Korean franchise was a restaurant operator’s dream. Guests lined up hours in advance of the opening (some all night)