

How much Americans spend at restaurants has fluctuated over the years, but lately, the numbers have been increasingly positive. Historically, grocery stores have taken the largest share of this pie. But in May 2015, restaurant spend had surpassed grocery spend for the first time in recorded history. Those who had been tracking the evolution in consumer spend likely saw this coming, and were prepared.
Utilizing data on spend from the US Census Bureau helps reveal changes in consumer behavior and can serve to anticipate lower spend in restaurants versus grocery stores during tough economic times. But aside from grocery spend, there are a number of consumer spending patterns and data points that can help determine how restaurant spend will stack up. We take a closer look, below.
A BREAKDOWN OF CONSUMER SPEND
Put simply, consumer spending is what households purchase in order to fulfill everyday needs: the goods and services we buy every day that keep companies selling and the economy moving. Nearly two-thirds of these are services, and include things like real estate, insurance, banking and healthcare.
The remainder includes US spend on durable and non-durable goods: gasoline, groceries, clothing, etc. Food falls in this category, as well.
There are several determinants of consumer spend:
Disposable Income — the amount of money that households have available for spending and saving after income taxes have been accounted for
Income Per Capita — the average income earned per person, in a given area (city, region, country, etc.)
Income Inequality — the extent to which wealth is distributed in an uneven manner among a population (the gap between the wealthy and the poor)
Household Debt — the amount of money all adults in a particular household owe to financial institutions
Consumer Expectations — The confidence of consumers, as illustrated in the Consumer Confidence Index. When people are confident, they are more likely to spend more.
HOW MUCH AMERICANS SPEND AT RESTAURANTS VS. GROCERY STORES
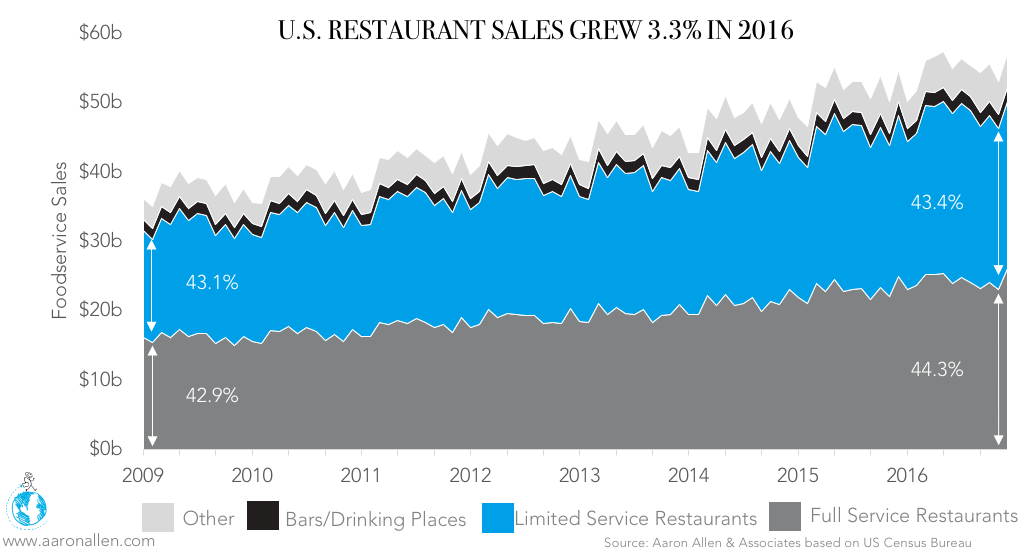
The US Census Bureau estimated that sales at Food Services & Drinking Places reached $56.01 billion in June 2017 (a 1.7% increase in comparison with June 2016). Sales at Food & Beverage Stores, meanwhile, were estimated at $59.44 billion in June (a 1.8% increase in comparison with June 2016). The share of sales at Food Services & Drinking Places comprises 49% of the two categories combined.
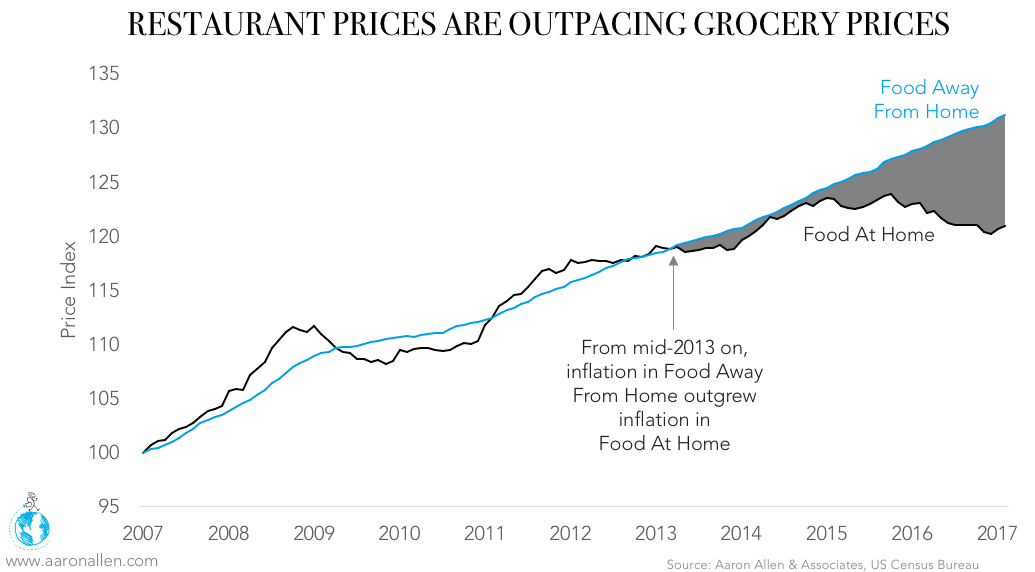
In the US, consumer prices for Food at Home (i.e. food purchased at grocery stores) decreased 0.1% in June, recovering slightly from the decrease seen in the previous month (-0.2%). It was the highest inflation rate since December 2015, which marked the onset of deflation. Consumer prices for Food at Home increased 2.2% in June, down slightly from the May average of 2.3%.
Growth in sales at Food Services & Drinking Places were estimated at 3% in June, double the growth of grocery store sales (1.5% in June). However, considering that inflation for Food Away From Home has been greater than that of Food At Home, the inflation-adjusted growth rates are quite different: sales at Restaurants and Bars grew 0.8% in June, in comparison to 1.6% for sales at Grocery Stores.
Though nominal restaurant sales continue to grow, when restaurant inflation is weighted in, how much Americans spend at restaurants has slowed in comparison to the previous year.
HOW PRICE PLAYS A ROLE
Despite the fact that restaurant sales in the US are growing, they’re doing so at the slowest rate of the last three years. Real growth decelerated 37% between the first quarters of 2016 and 2017, while grocery sales grew 2.8 times faster. One issue? While restaurant prices continue to increase, groceries have become cheaper, raising the opportunity cost consumers face when deciding whether to dine out.
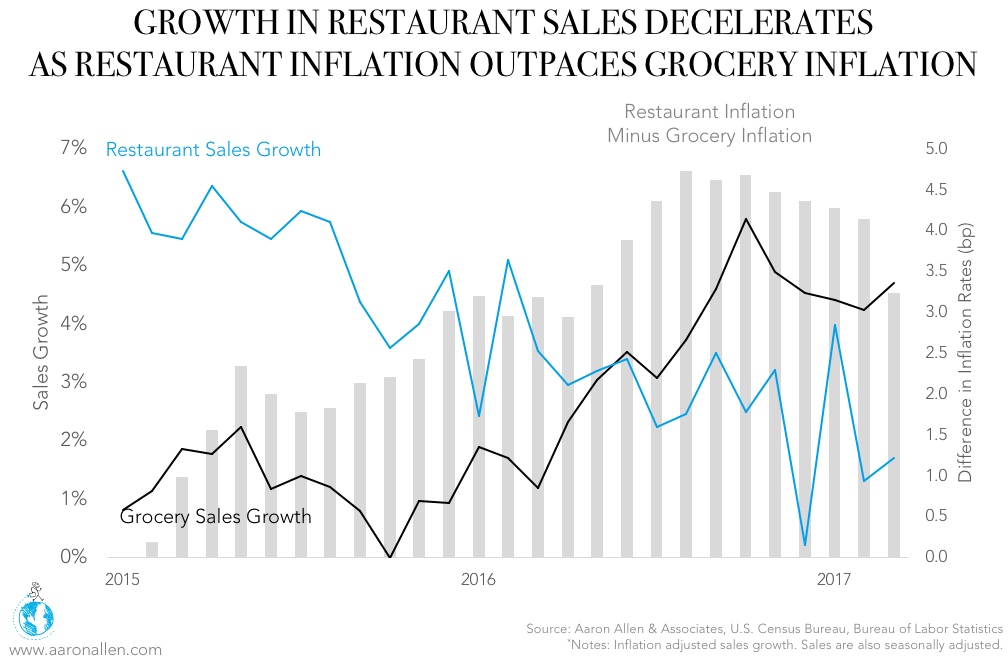
Another sticky point for restaurants is inflation. Price inflation grew four times faster for Food Away From Home in 2016, helping grocery stores and other food retailers claw back a bit of share lost to restaurants in the years prior.
Still, even though growth ebbs and flows, foodservice remains one of the most predictable industries with consistent cashflows (especially in emerging markets) — one of the primary reasons we’ve seen so much investor interest in the space. Foodservice grows in parallel with GDP, inflation, population, lifestyle/consumer discretionary spending variables, and evolving dining behaviors (plus a few other macros – all easy enough to forecast). The rest comes down to the performance of operations, marketing, and leadership. True-to-form, the US restaurant industry (the world’s largest) grew again in 2016. Globally, restaurants are up +4% (now topping $4 trillion).
HOW MUCH AMERICANS SPEND AT RESTAURANTS HINGES, IN PART, ON CONSUMER SENTIMENT
The consumer confidence surveys released every month (one by the Conference Board and the other by the University of Michigan) are indexed arbitrarily to 100. The higher the level, the more positive consumers are about the economy and the more willing they are to spend.
The index for consumer sentiment (as monitored by the University of Michigan) decreased during the last two months (it stands at 93.4 as of July versus 95.1 in the previous month). The Index is still 3.8% above its reading in July 2016.
Personal Consumption Expenditures increased to $13.29t in the second quarter of 2017 (up 4.2% from the same quarter of 2016). Expenditures in Food Services accounted for 5.6% of personal consumption expenditures, and increased 2.7% as compared to the same quarter of the previous year. The nominal growth in expenditures in Food Services (that 2.7%) was slower than the growth of spend in other services (4.9%) and also slower than the growth of spend in goods (3.2%).
These improving attitudes can largely be attributed to a robust labor market. Stronger views about household financial well-being seems to indicate that consumer spending will continue to expand and power the economy — a particularly positive indicator for restaurants, as how much Americans spend at restaurants is often a direct result of increased consumer sentiment.
In addition to consumer sentiment, population growth plays an important role in determining how much Americans spend at restaurants. Over the last 15 years, the number of people per restaurant has decreased 12%. Last year, the growth in restaurants outpaced population growth 2-to-1.
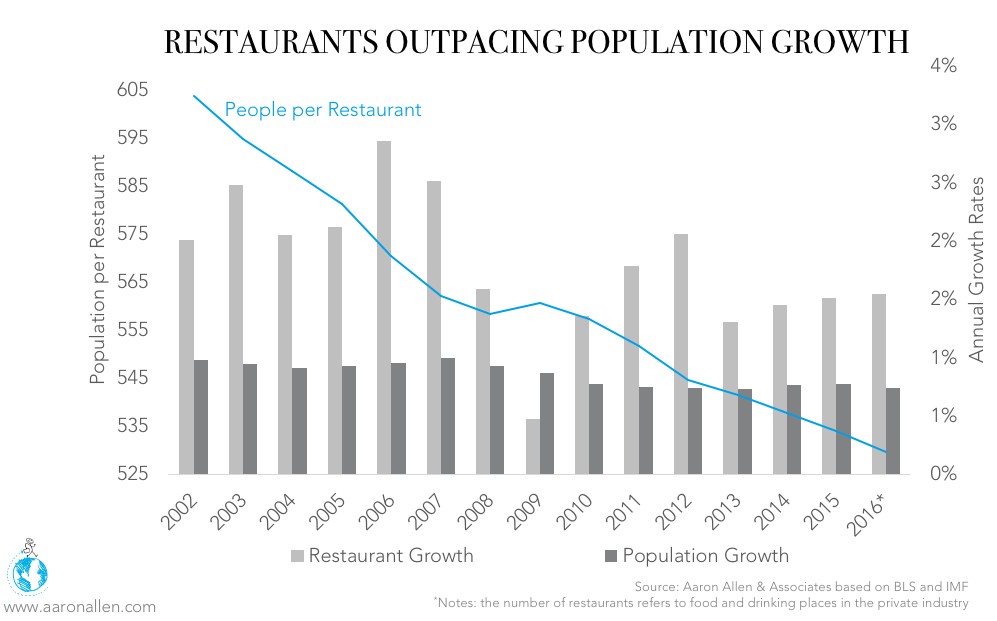
In other words, restaurant concepts continue to multiply, at a faster rate than consumers. Saturation is therefore increasing and competition is more difficult to break through than ever. Differentiation is critical — for both restaurant chains and those who choose to invest in them. There remains tremendous opportunity in the realm of casual dining and it’s no longer enough to simply keep up.
ABOUT AARON ALLEN & ASSOCIATES:
Aaron Allen & Associates is a leading global restaurant industry consultancy specializing in growth strategy, marketing, branding, and commercial due diligence for emerging restaurant chains and prestigious private equity firms. We have helped helped restaurant companies around the world drive revenues, increase profits, and enhance the guest experience through improved marketing, messaging, and menu engineering. Collectively, our clients post more than $100 billion, span all 6 inhabited continents and 100+ countries, with locations totaling tens of thousands.