
If you’ve spent any time around investors, you’ll know that many are obsessed with Total Addressable Market (TAM).
But what is it? Why does it matter? How should I be thinking about it, you may wonder.
There are a lot of angles to consider.
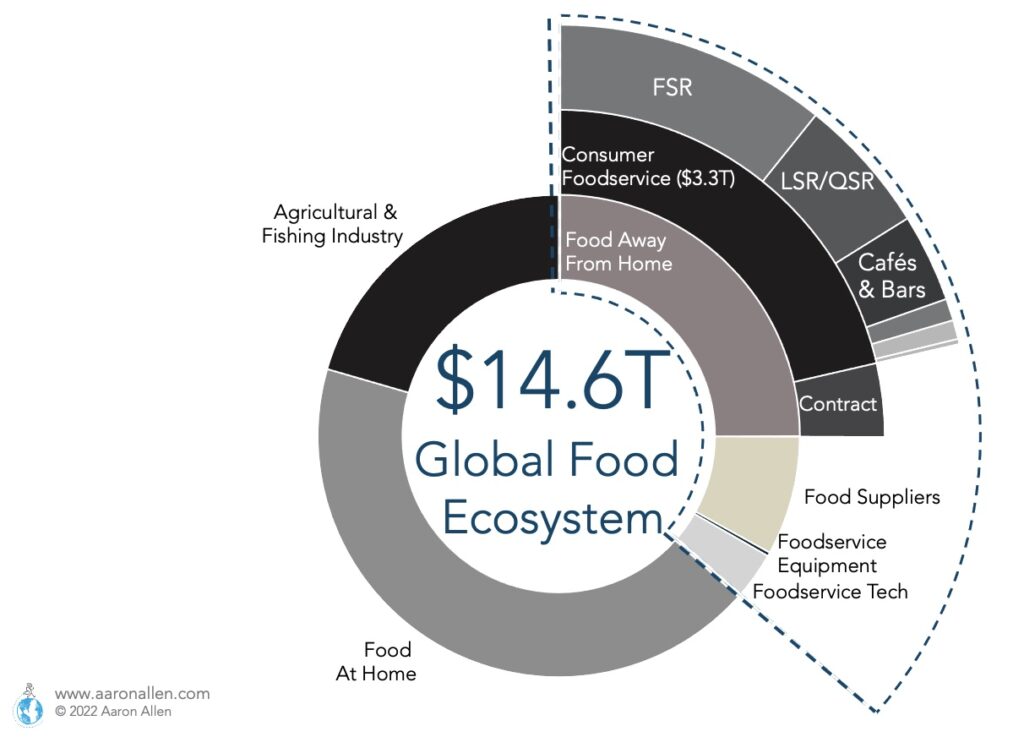
While we primarily address the full $14.5 trillion global foodservice industry and related ecosystems, our TAM in terms of ideal fit for our top-to-top consulting model is only around 10,000 companies worldwide. Restaurants represent less than one-third of the total width and breadth of the industry, roughly 23 million rooftops globally. When you think about it that way, you can see why we realized long ago that there are actually more “consultants” than there are restaurants (little wonder why our “competitors” have come and gone so fast in our space).
Total Addressable Market is coming up a lot more frequently these days for our tech-oriented clients and their investors who are struggling to understand the difference between the total “addressable” market and the total market “addressed” — the difference between what is possible and what is plausible.
What to Consider When Calculating the Total Addressable Market
Ultimately, it’s about determining how well a company has thought through:
- What’s the problem you are solving?
- Who has this problem? How persistent or prevalent is it? Who wants it solved?
- Is it profitable to provide the solution: can you provide thrilling results profitably?
- What’s most important to the addressable market and how well do you address it?
- Who else is trying to do the same thing? How do you compare?
- Is the market growing or is it shrinking? Is competition intensifying or easing?
- Do you have non-traditional competitors or alternative foodservice formats taking part of the market share?
- How likely is it that margins will be compressed or erode over time?
It’s easy and obvious, right?
Not really.
Every company eventually struggles with these questions.
As you work through these rather straightforward questions you heard first in your high school economics class, you begin to realize how important it is to review the list and refine answers and strategies over time as conditions change and evolve — especially when such an enormous global industry has been turned on its head and is looking for a better way forward across every category, geography, ownership type, and functional area of the business.
For instance, we realized (while our founder grew up in a family-owned restaurant as a third-generation restaurateur and we love mom and pop businesses) we’re not able to profitably address the challenges small operators have with our holistic approach. That’s why we give the ideas away for free for this audience via our newsletter, blog, and social media channels.
TAM Applications: The Example of POS Companies
Another recent example can be found looking at restaurant point-of-sale (POS) companies.
Toast POS recently realized they couldn’t profitably address large enterprise accounts and that trying to do so was such a drag on their business they had to lay off roughly 1,600 employees just before their IPO – representing nearly their entire enterprise sales division (which they’re now trying to rebuild and find new competitive footing to help them gain traction they couldn’t find before).
Nearly every POS company has called us at some point (their investors too). When you look at the evolving landscape in just this one category of the B2B ecosystem in the industry you will find a fascinating example of an industry category self-organizing. Some have decided to differentiate with new combinations and channel communication strategies. Some levers and dials they use to hone in on “where to play” and “how to win” when they look for their own unique formula and combination of…
- Features
- Pricing (Structures, Models, High/Low, Upselling, etc.)
- Positioning (and advanced Counter-Positioning)
- Channel / Category Strategy (Segmentation Strategies)
- Marketing Channels/ Mix
- R&D / Development Roadmap
- Geographical Focus
- Partnerships (JV and Reseller Strategies)
- Buying Share and Capabilities (M&A Strategies)
The more sophisticated the organization, the more tools and resources they have to design strategies and win share. And the bigger they are, the more likely they are to augment their own internal insights and capabilities with the objectivity and outside their four walls experience capable advisory firms can deliver. We learned that’s more where we should play as well — companies that need breadth and depth of technical and multi-national industry experience (making it easier for us to find each other to connect on inspiring and profitable ambitions together).
The Power of Differentiation when Calculating the Total Addressable Market
If you ever want proof of the power of differentiation, take a stroll down the toilet paper aisle at your local grocery store.
As you know, shelf space in competitive retail environments is expensive to come by. So why is it then grocery stores will dedicate up to half a full aisle just to toilet paper?
Differentiation Wins a Place in Minds, On Shelves, and in Wallets
Some clever paper company would have come in to explain how some people want the best and will pay for double-ply toilet paper. Someone else says women prefer pink, and so their colored toilet paper wins a spot. Yet another says they’re the only ones with aloe vera-infused toilet paper (and the associated benefits, justifying their shelf space). And then there’s always the offering for the budget conscience, and so something barely better than leaves and tree bark wins their spot as the low-cost leader.
What Does the TAM Mean for You?
We wanted to take this opportunity to remind you Q3 is the best time of year to revisit questions like these so you still have time to get your most important initiatives funded in Q4 so that you’re leapfrogging the competition (and/or preventing being leapfrogged) in 2023
- Leverage the latest industry intelligence to triangulate your position and performance
- What is our global TAM?
- Are there any use cases we are not leveraging?
- How do we identify new opportunities and size them?
- Refine your findings to an actionable plan
- How do we drive revenue in a way that works over the short- and long-term?
- How do we build brand-centric strategies?
- How do we modernize and move to adjacent markets to amplify the TAM?
- Build the Business Case
- Define the Technical Specifications (Plus Parameters and Guard Rails)
- Enlist Multi-Disciplined Teams to Make Unique Contributions
- Keep Shareholders and Stakeholders Informed and Engaged (Share the Limelight)
- Apply Principles of Iterative Refinement; Focus on MVP (Minimum Viable Product)
- Design, Develop, Deploy, Debrief – Work with Smart Stage-Gate System(s)
- Add to the Corporate Consciousness and Knowledge Centers: Archives & Lessons
- Celebrate Successes and Failures (Both Are Valuable When Done Right)
In other words, to effectively get your “toilet paper” some shelf space in the company’s 2023 budget, you’ll need to apply the questions and approaches touched on here in a variety of ways and by combining results that connect multiple stakeholders and other factors that must be aligned simultaneously:
- Current customers/clients – how to move to advocacy (frequency, check average, etc.)
- Prospective customers/clients – how to find, attract, convince, convert, retain
- Alignment with company ambitions and wherewithal
- Internal buy-in and approvals (effectively how to win friends and influence people)
- Competitive blind spots, deficiencies, shortcomings (which battles and battlegrounds)
If it feels overwhelming, that’s because it often is. You’ve got a day job, after all. That’s why advisory firms like ours exist — these are workloads that are best shared. No one organization has every answer under their roof (if they did, they’d be inefficient by way of having an overabundance of idle resources).
Planning in Order to Gain the Most Market Share and Amplify the TAM
Additional driving questions you may want to ponder this “planning season”:
- How can we drive the enterprise value of the business in the year(s) ahead?
- Where can we find new opportunities for growth, expansion, and revenue?
- How can we win more hearts and minds with our brand internally and externally?
- Are there more creative ways to “optimize” vs. just “reduce” costs?
- What are the highest-impact areas that require capital investment?
- How do we prioritize resource allocations with so many worthy choices?
- How should we sequence strategies, priorities, and other items on our critical path?
- How do we rank and compare against competition and benchmarks?
- What should we acquire, divest, create, hold, grow, accelerate, or discontinue?
- How can we be sure the years ahead of us are better than the years behind us?
If you find yourself wishing you had help gaining enthusiastic support for strategic initiatives you know are needed in your organization, call in the support you need to spark change, fan the flames of potential, and grow like wildfire. That’s totally what we’re here to help you address.
Definitions & Frequently Asked Questions: Understanding Total Addressable Market, Serviceable Available Market, and Serviceable Obtainable Market
Total Addressable Market (TAM)
The Total Addressable Market is the annual demand for a product or service, calculated as the industry potential for sales. For example, for a restaurant chain in the U.S. the TAM would be around $900 billion, which is the annual expenditure in food away from home.
Serviceable Available Market (SAM)
The Serviceable Available Market is a subset of the TAM. It’s narrowed down to a company-specific category or segment. For example, for a QSR chain, this would be about half of the TAM.
Serviceable Obtainable Market (SOM)
Serviceable Obtainable Market is what of the SAM could be reached. For a QSR company, this could be the maximum market share within QSR achievable.