As a central element of any company’s regular reporting, restaurant income statements can be sliced a variety of ways to quickly uncover inefficiencies. These ratios also demonstrate the very different business models of heavily and lightly franchised systems.
Median Revenue per Employee in Public Restaurant Companies $61.3k
Compared to other industries, public restaurant companies in the U.S. have relatively low revenue-per-employee rates. Energy companies make just under $1.8m per employee, and supermarkets make $196.7k per employee, but the median revenue per employee in publicly traded restaurants in the U.S. is $61.3k.
But even within this rank, the results show a misleading disparity. Restaurant Brands International (RBI) made $871,638 per employee in 2017, but that’s because, as a 100% franchised system, they have only 6,200 employees. In comparison, Chipotle had a similar revenue level ($4.5b), but, with almost 70k employees, their ratio was less than a tenth of RBI’s, at $67,083.
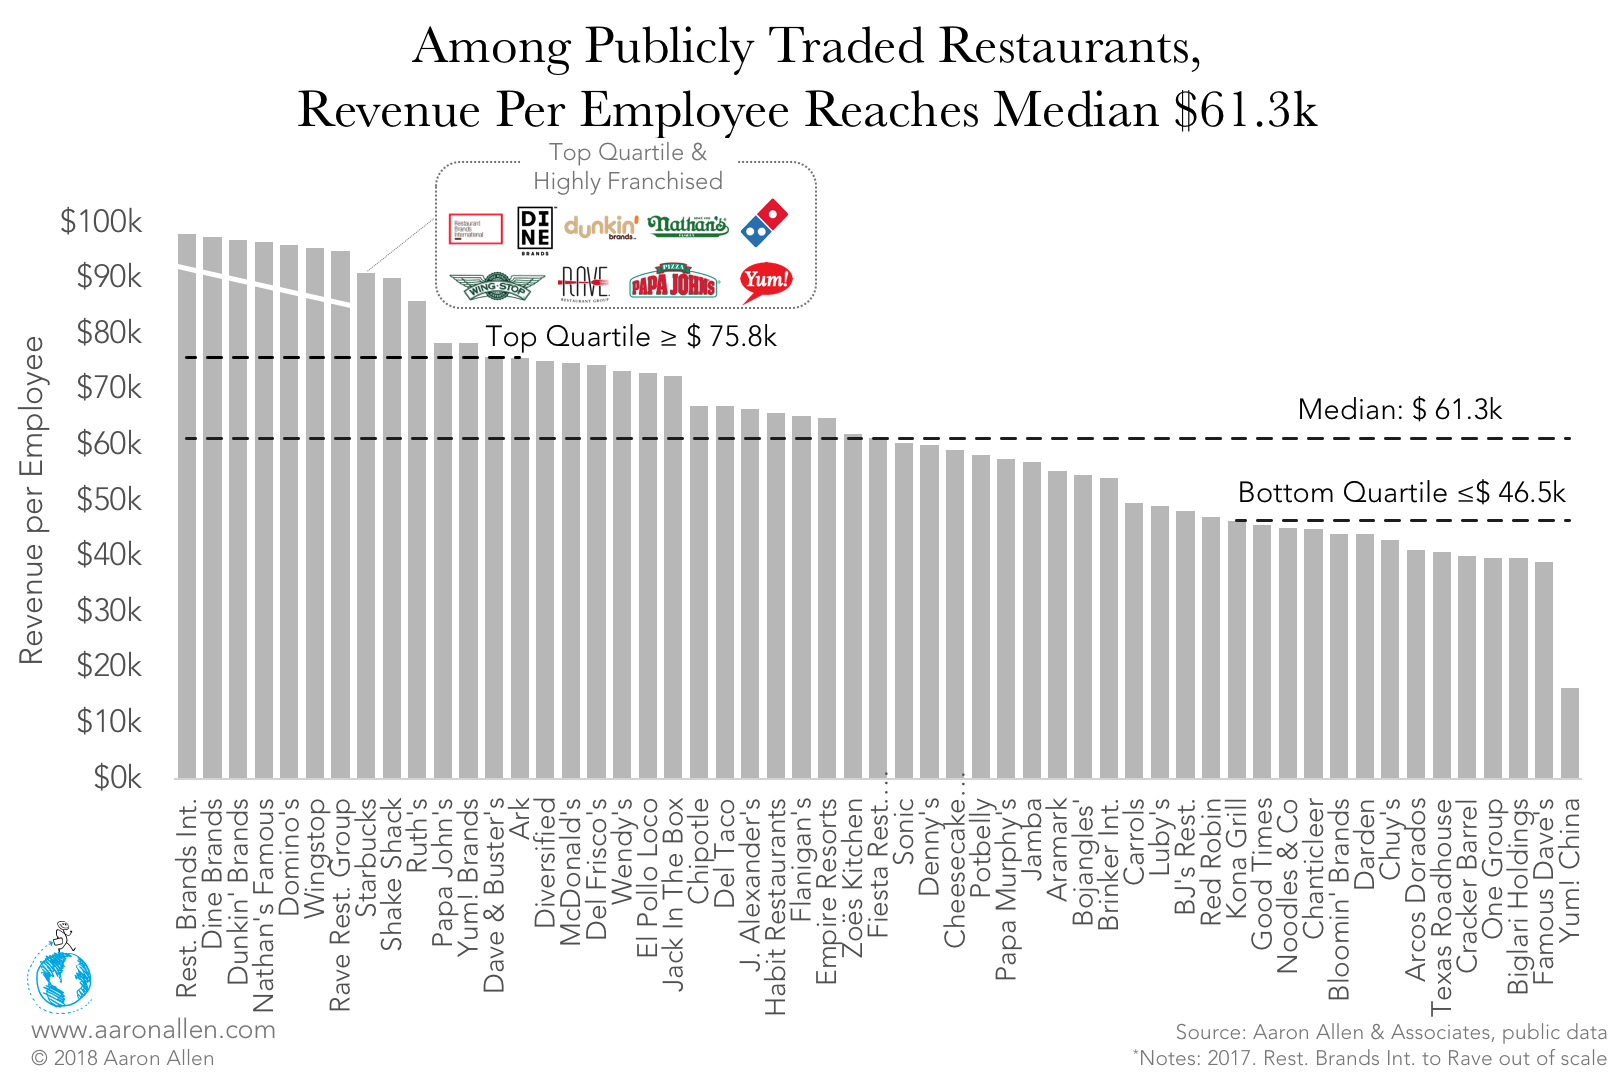
At the other end of the spectrum, Yum! China has the lowest revenue per employee, with just $16k. The company was spun-off from Yum! Brands in 2016, making it relatively young. In 2017 alone, it added 30k new employees — a typical move for young organizations that want to fill out all the available positions and prepare for increasing demand while revenues are still growing.
Net Profit per Employee Sits at $2.0k
Having the highest revenue per employee doesn’t mean the company has a high net profit per employee. Dine Brands — another highly franchised system — had the second highest revenue per employee ($806k), and it also has the lowest net income per employee, amounting to a $447k loss for every worker.
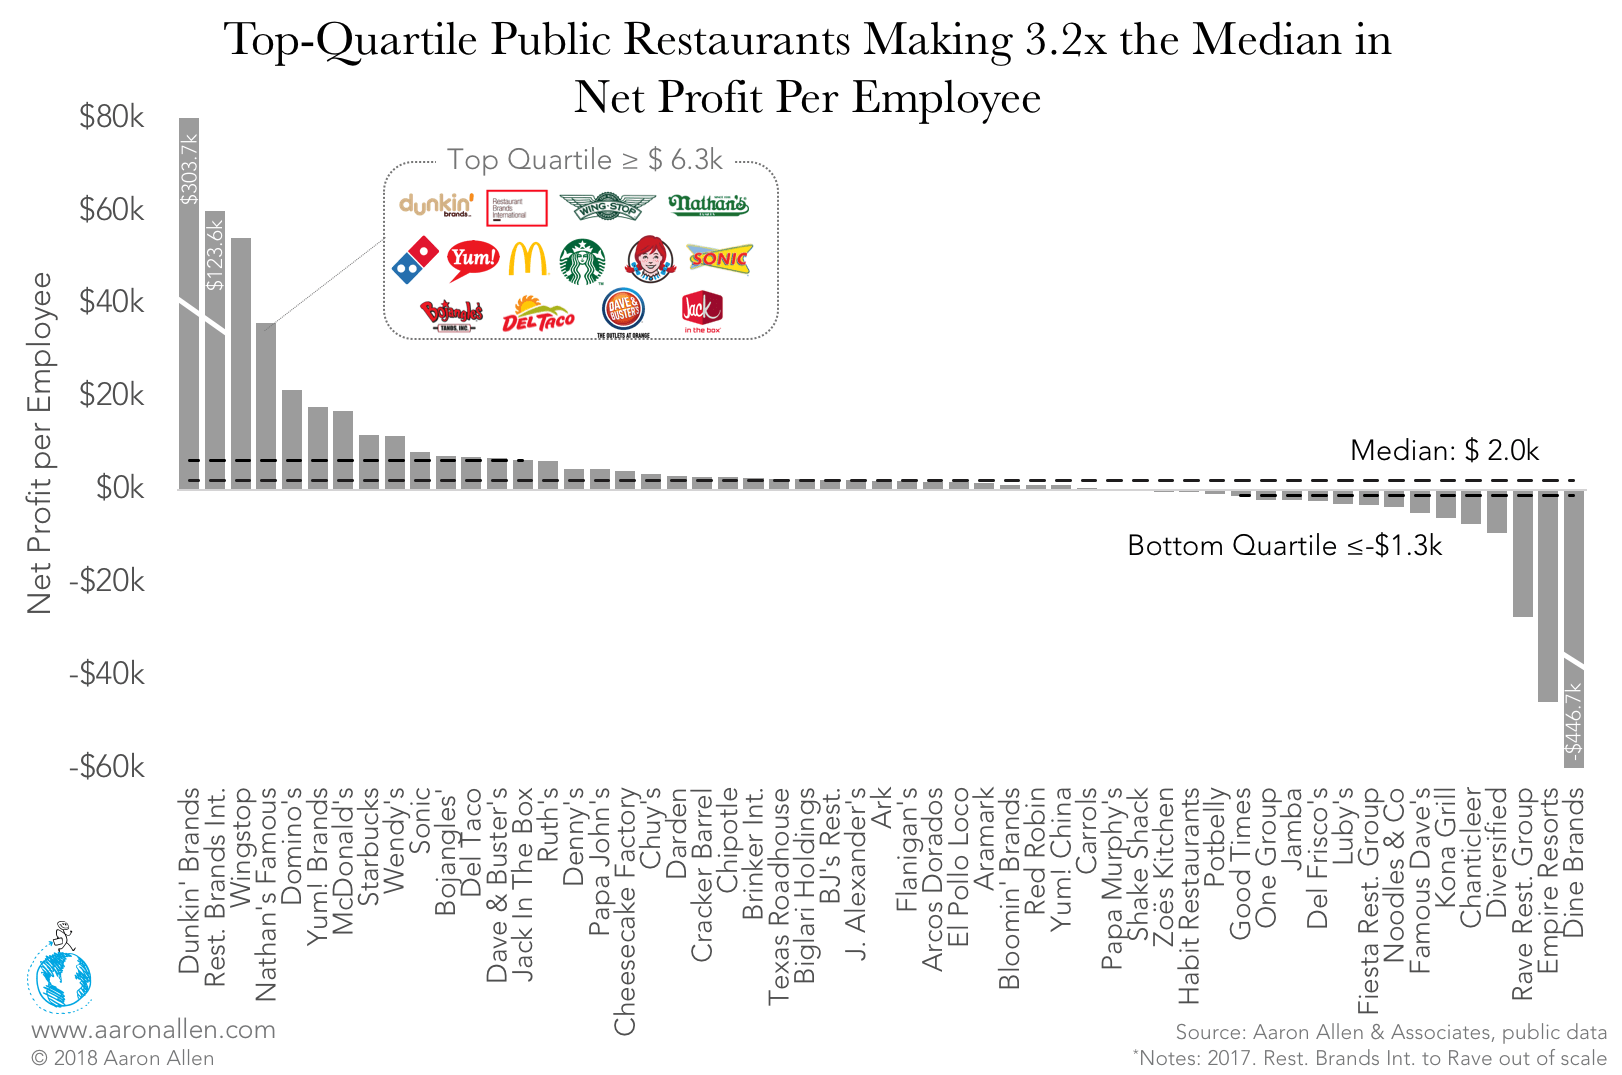
In 2017, the company reported a net loss of $330.5m thanks to deteriorating profit margins from large debt expenses, lower royalty income due to franchisees’ weakened sales, and an increase in capital allocation to the Applebee’s national advertising fund. The company counts only 520 employees.
On the other side, Dunkin’ Brands’ net profit-per-employee ratio of $3.1m is the highest in the industry. With a 100% franchise rate, the employees at the unit level are not included in the employee count.
Food Costs Hit High-20% Range for Most Segments
Coffee/beverage/snack chains have a median food-cost-to-sales ratio of 13.4%, which is well below other segments, most of which have ratios in the high 20s.
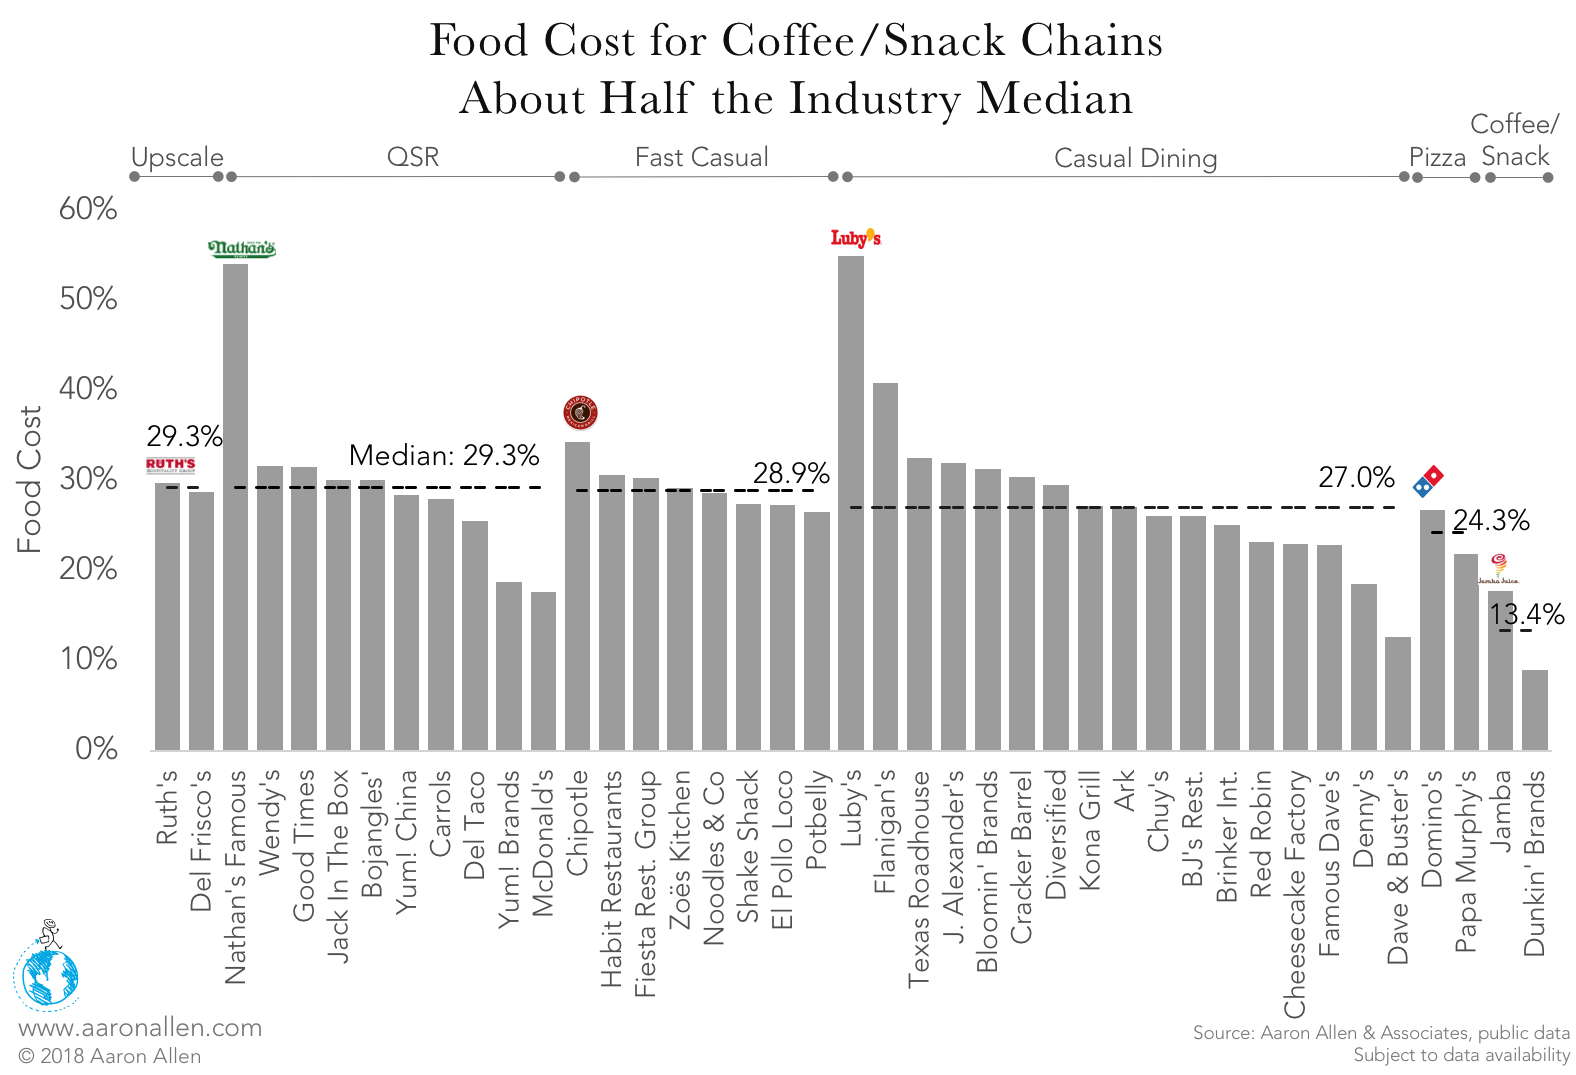
Relying heavily on beverages and light snacks, which allow for higher margins than other segments, keeps this segment’s food costs low.
The fast-casual segment has the highest medianfood costs (28.9%) due to increasing commodity prices and deteriorating same-store sales at many chains in the segment, following the burst of the fast-casual bubble.
Median Labor Costs at 29.1%
Based on public restaurant companies’ 10-K forms, the industry median is 29% in labor costs. Top-quartile companies, which in this instance indicates the weakest performers, had labor costs eating at least 34% of their revenue.
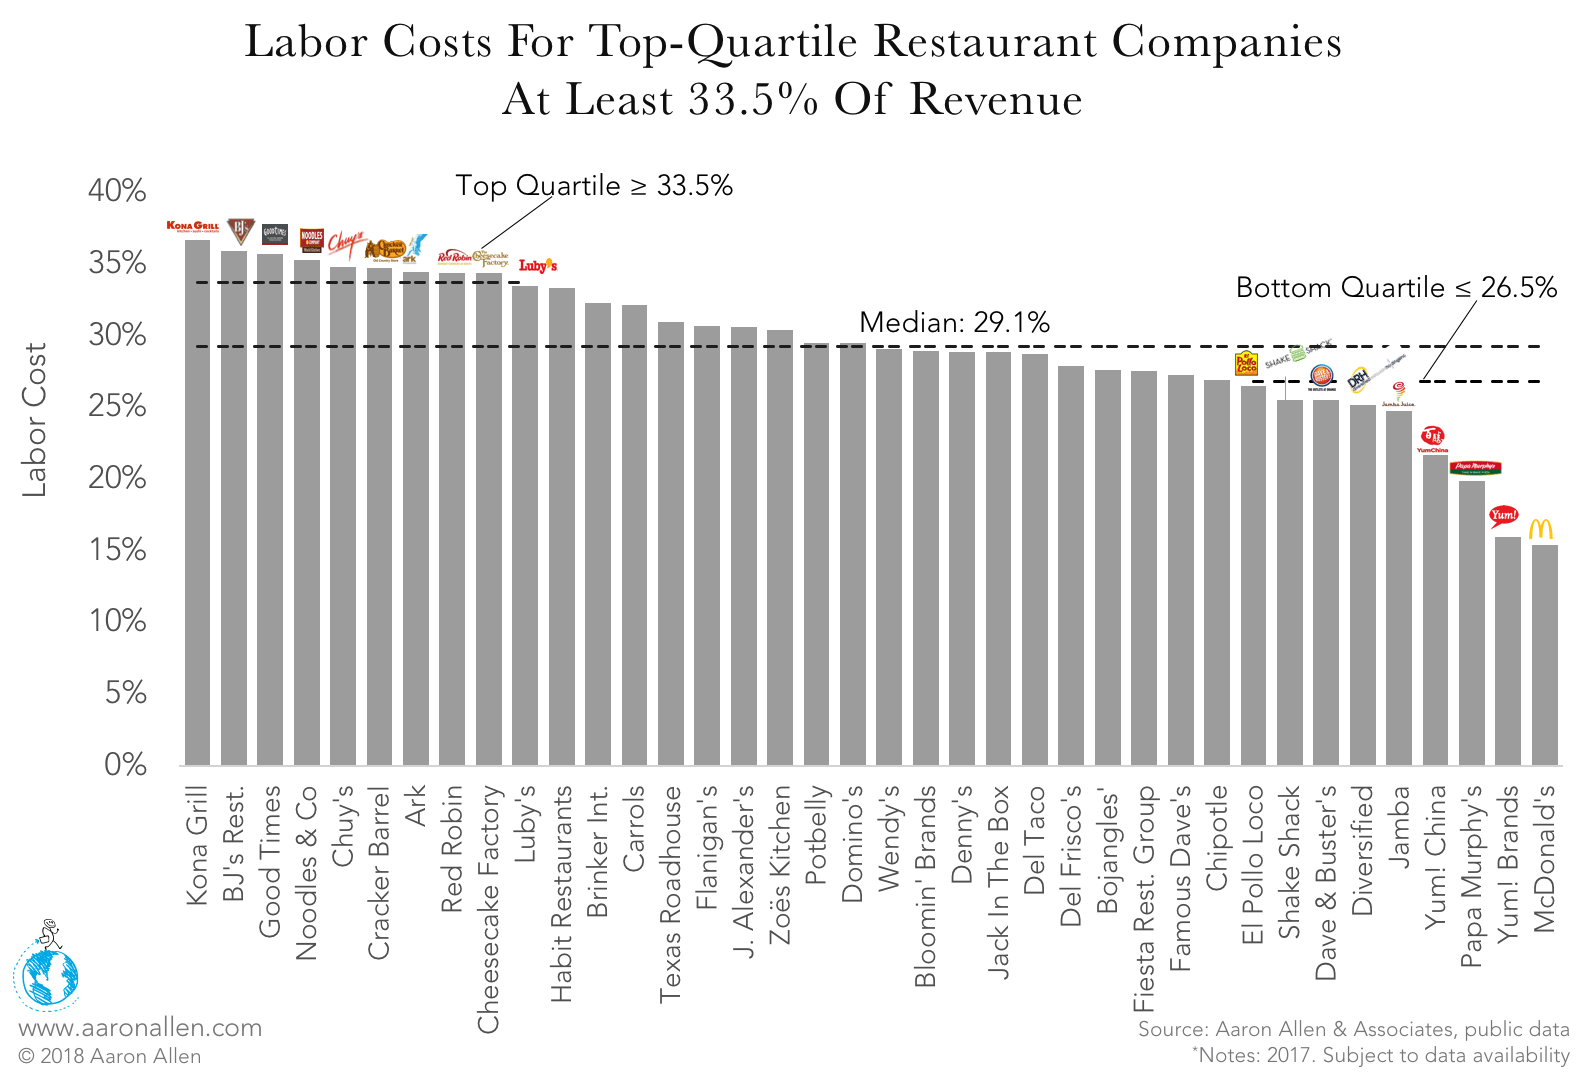
In 2017, Kona Grill’s labor costs as a percentage of revenue rose to 36.7% from 35.1% in 2016, reflecting increased expenses at newly opened locations. Of course, wages at new locations and start-ups will always be higher, as there are not yet sales to offset them. If pre-opening labor costs go toward training and enculturation programs, the slight increase will pay off in the future.
On the other side, McDonald’s had a very low labor cost, again thanks to franchise rate, which is projected to reach 90% this year. Only 235k employees are counted in its labor costs, a tiny proportion of the line-level employees, managers, and franchisees that staff its 36k+ locations worldwide. It has also introduced self-order kiosks, which could cut labor costs over the long-run, though the company has publicly stated that it does not intend to replace employees.
Median Occupancy Cost for Publicly Traded Companies in the U.S. 7.9%
The median occupancy costs for publicly traded restaurant companies in the U.S. sits at 7.9%. Struggling sandwich chain Potbelly incurred the highest occupancy costs, at 14%. This figure surged by 11.7% to $58.6m in 2017, mainly due to new store openings and an increase in rent expenses, real estate taxes, and common area maintenance, combined with declining same-store sales in company-operated locations.
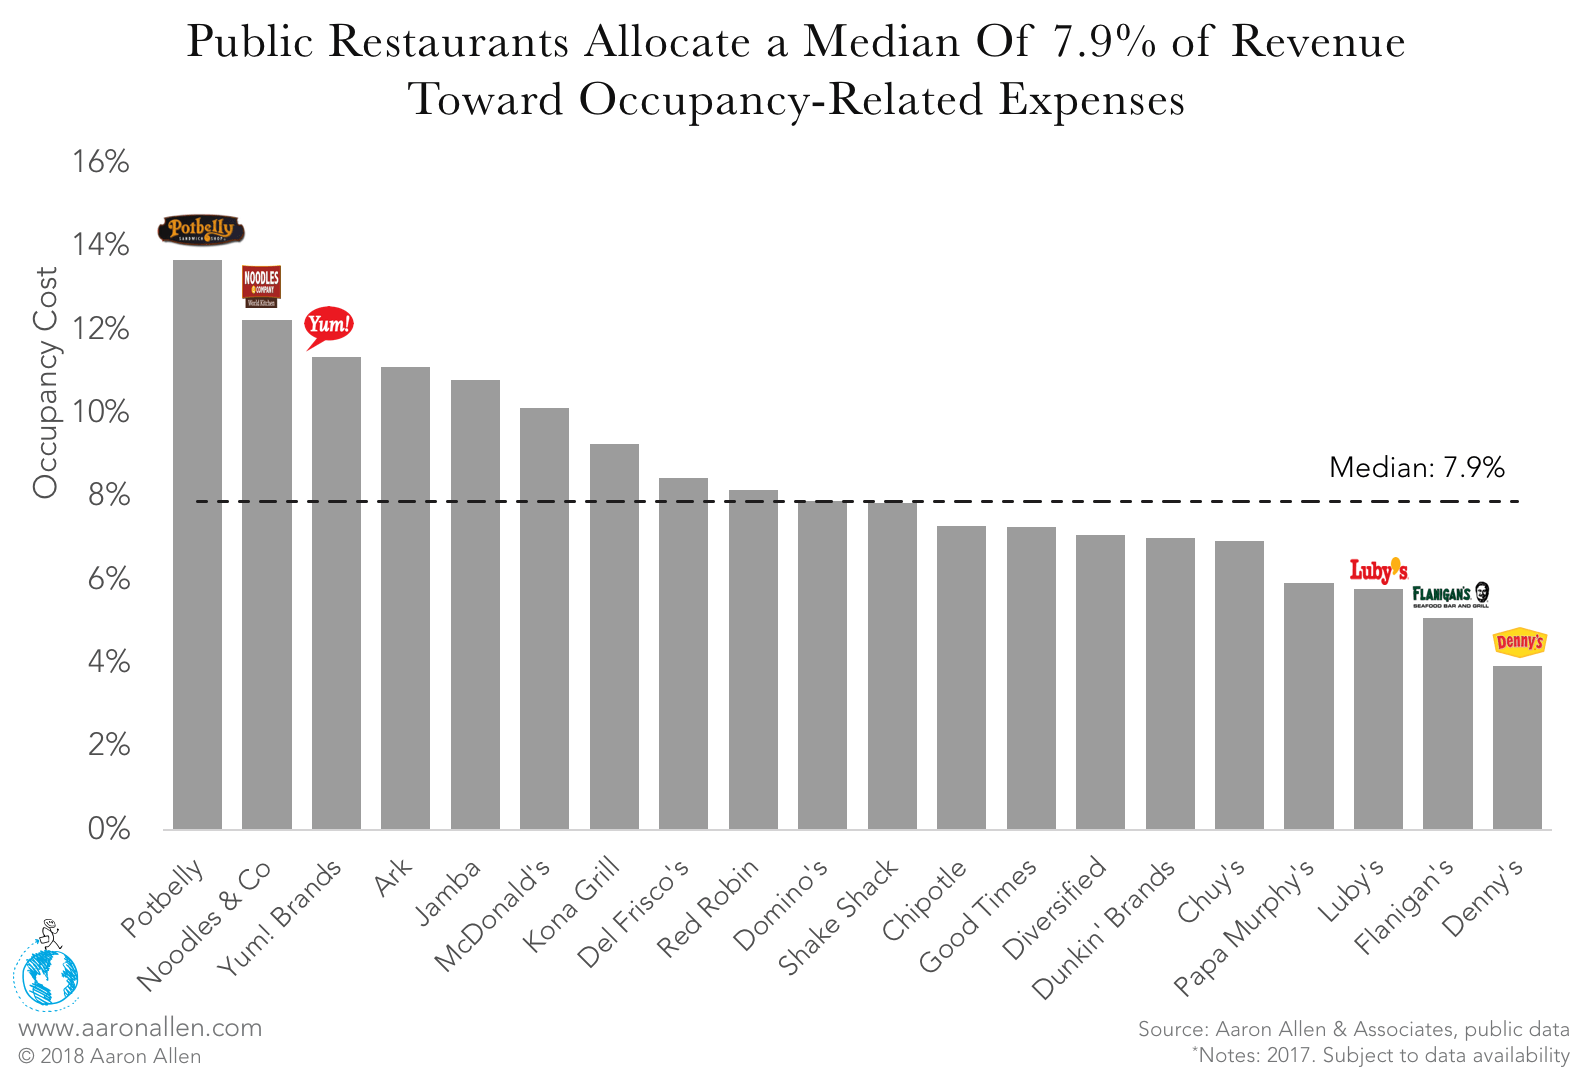
On the other side, Denny’s incurred only 4% occupancy costs thanks to the company’s high franchise rate (90% of locations), which passes those expenses on to franchisees.
These ratios show how much franchising can cut down costs across all aspects of a restaurant operation, but they don’t demonstrate how franchising cuts revenue, since sales are kept by franchisees, or how it can impact intangible value by diluting the brand.
There’s no magic formula for the rate of franchise-to-company-operated units. Instead, leadership teams should consider how franchising ripples out across areas of the operation and make the choices the best align with the organization’s long-term strategy and unique value proposition.
ABOUT AARON ALLEN & ASSOCIATES
Aaron Allen & Associates is a leading global restaurant industry consultancy specializing in growth strategy, marketing, branding, and commercial due diligence for restaurant chains and prestigious private equity firms. We work alongside senior executives of some of the world’s most successful foodservice and hospitality companies to visualize, plan and implement innovative ideas for leapfrogging the competition. Collectively, our clients post more than $200b in sales, span all six inhabited continents and 100+ countries, with locations totaling tens of thousands.

