
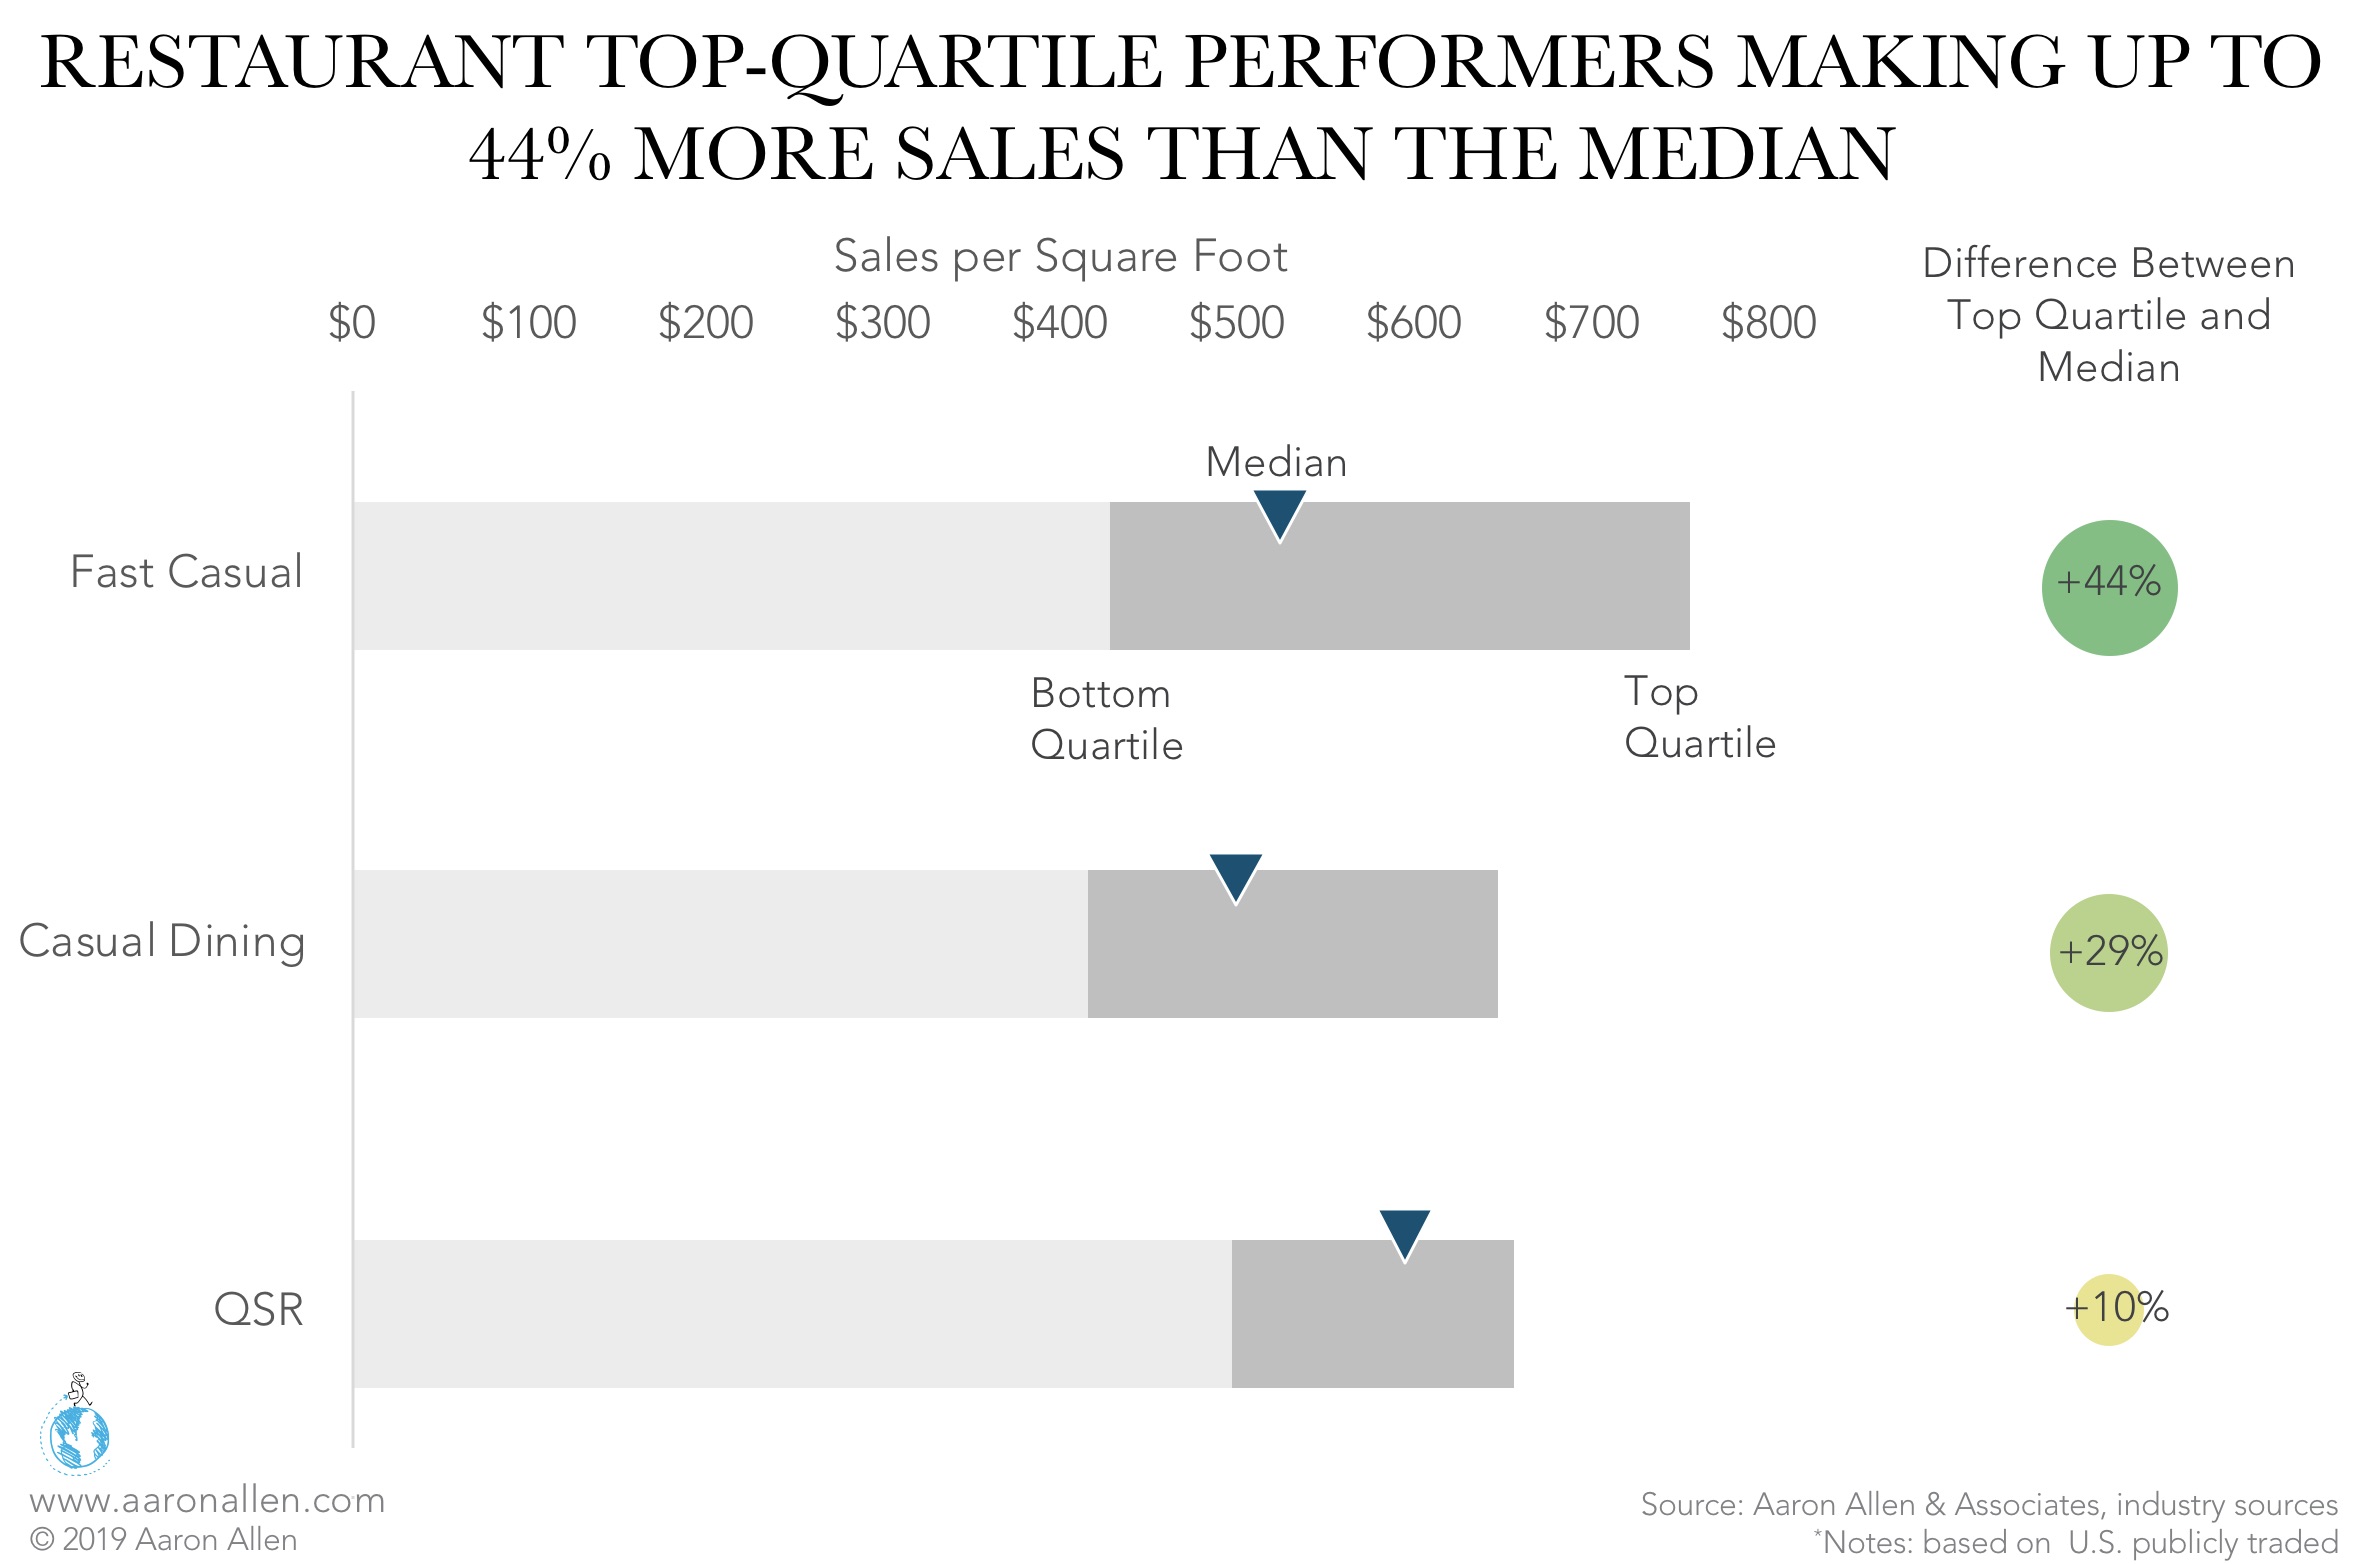
Among U.S. fast-casual restaurants, top-quartile performers are achieving 44% higher sales per square foot than the category’s median. For casual dining and quick-service restaurants (QSRs) these differences amount to 29% and 10%, respectively. A deep understanding of the forces driving consumer behavior and competitive performance allows to identify where and why variances in performance exist, and to obtain answers for how much and how long it would take to make the transformations to turn restaurant brands and operations from average to the top.
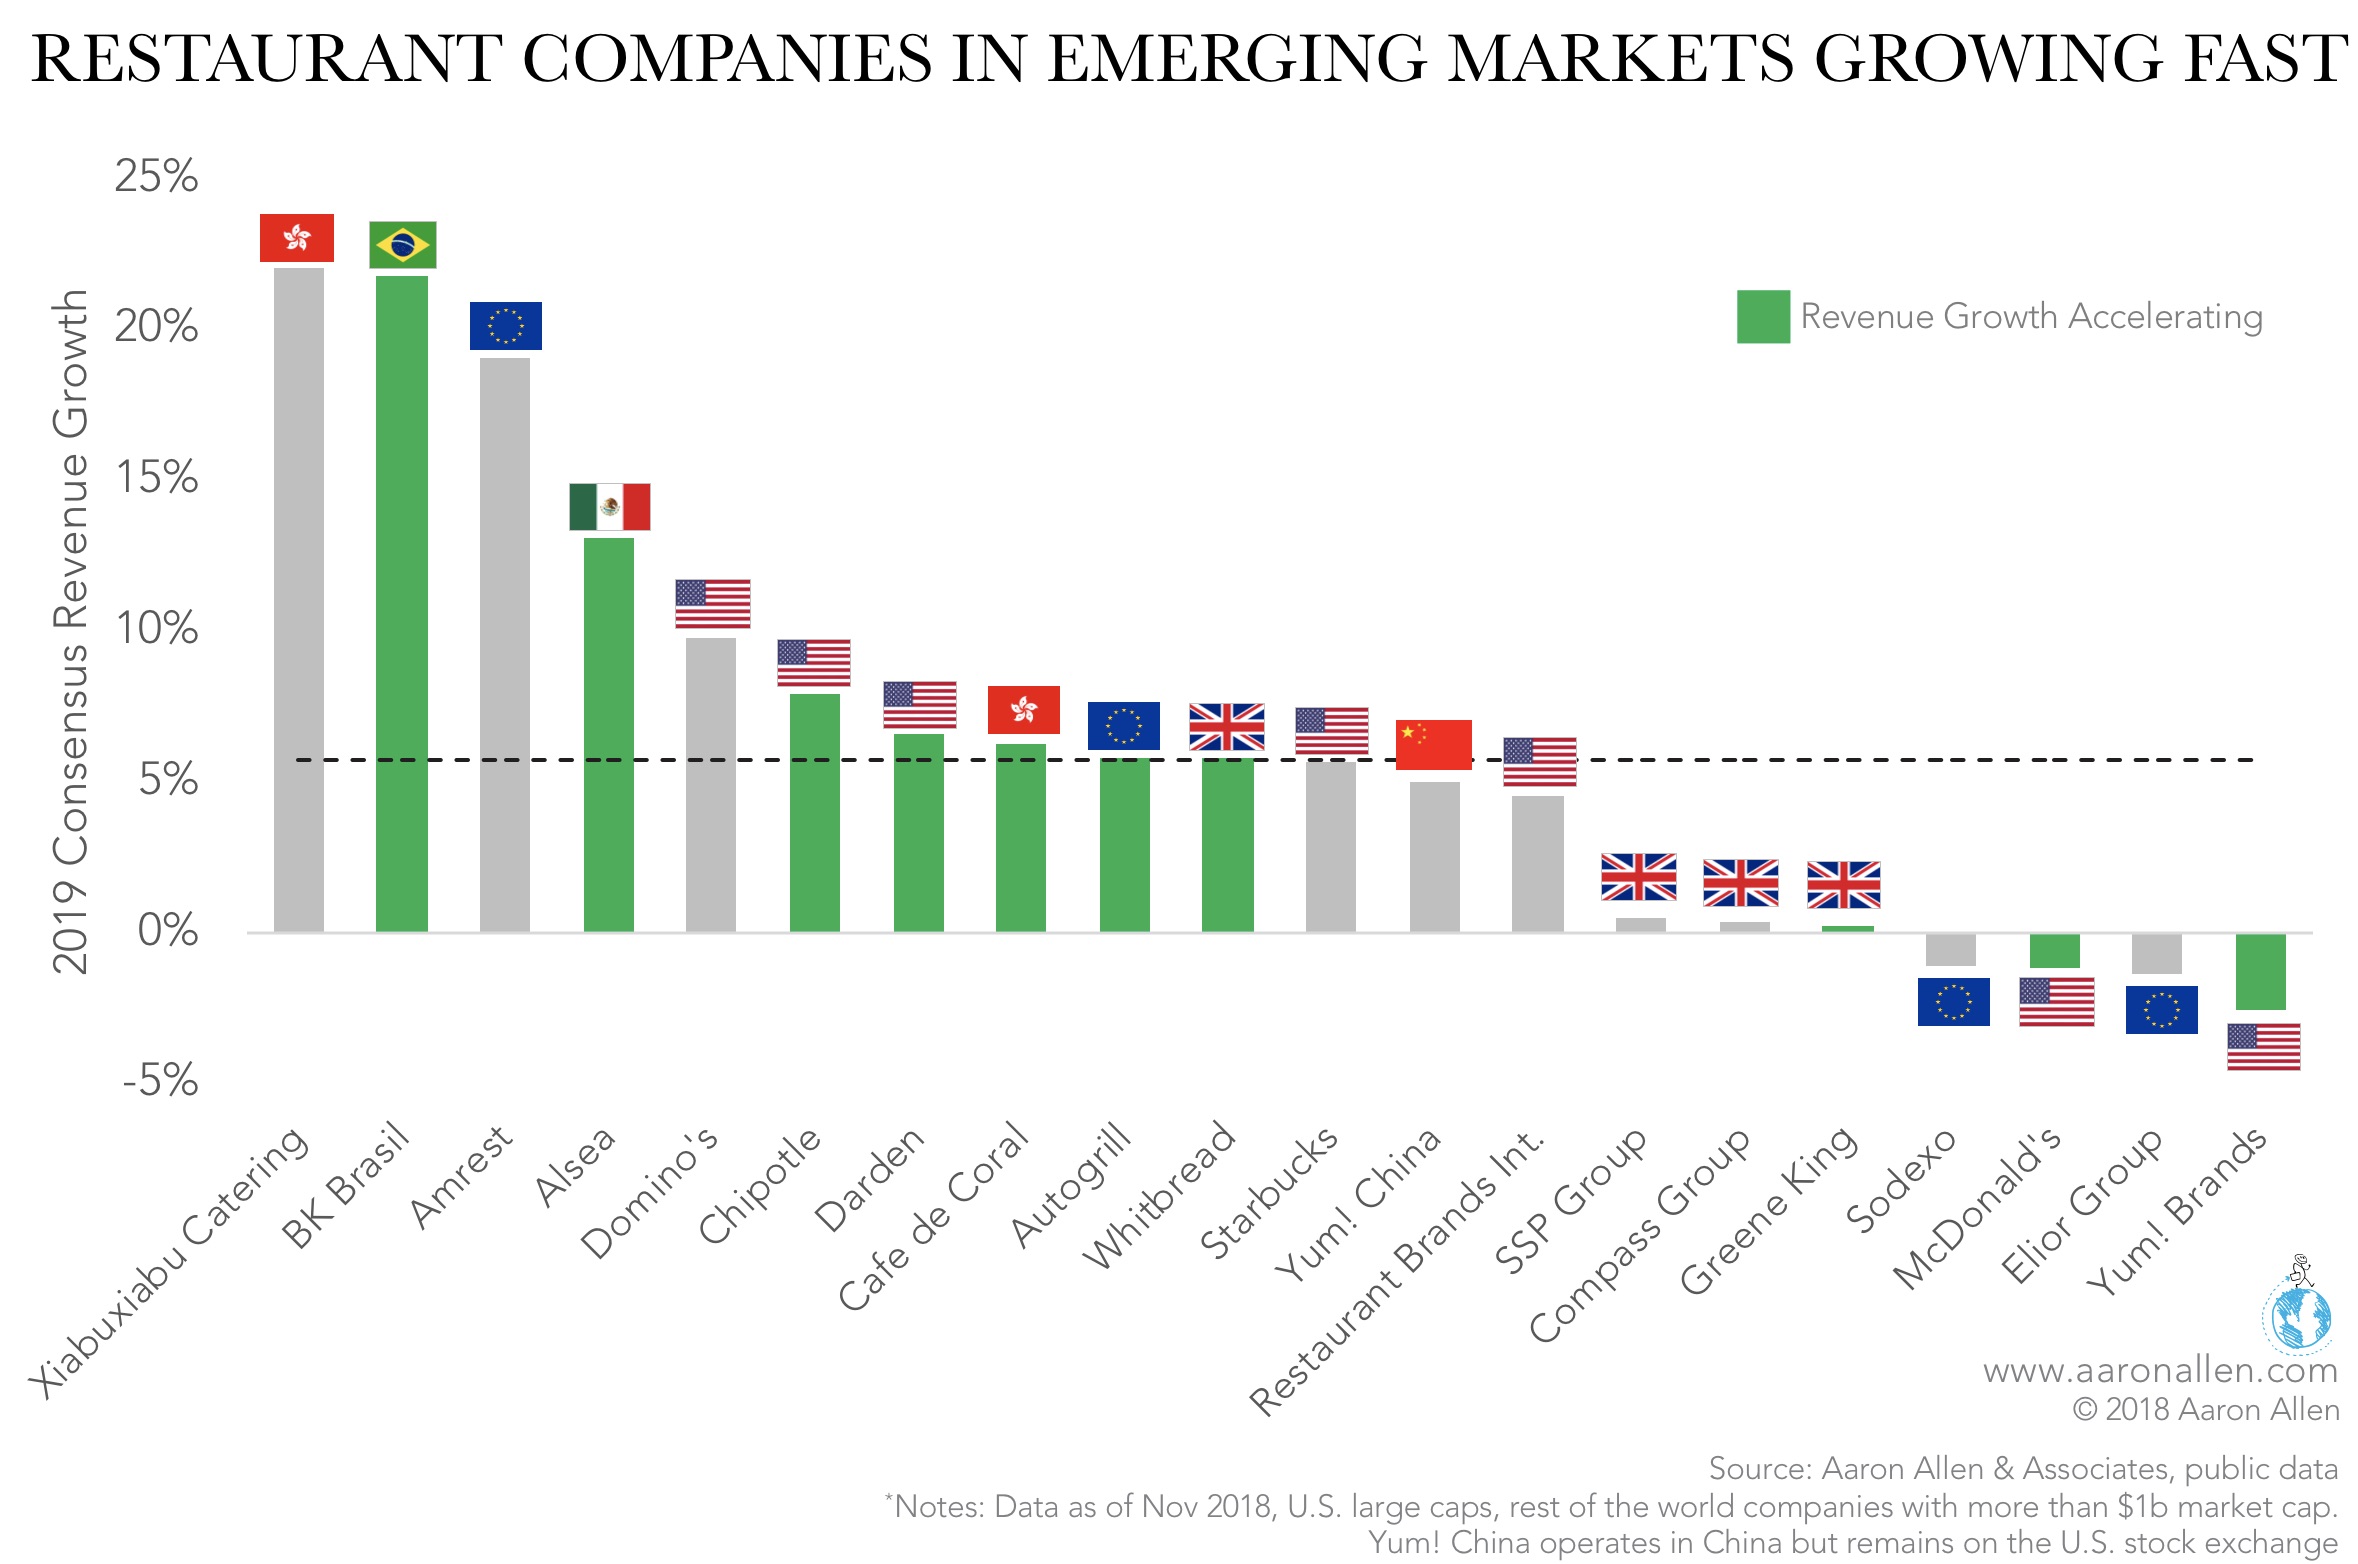
Consensus forecasts for twenty of the largest publicly traded foodservice companies around the world favor emerging markets. In this group, three of the five fastest growers (based on annual revenue for FY 2019) are in emerging markets: Xiabuxiabu Catering (a QSR hot pot chain), BK Brasil (Burger King franchisee), and Alsea (multi-concept operator of brands including Domino’s Pizza, Burger King, California Pizza Kitchen, Chili’s Grill & Bar, PF Chang’s China Bistro, and Starbucks). It’s worth noting that revenue growth may differ from sales depending on the organization’s franchise ownership mix, and some of the weakest growers, like McDonald’s and Yum! Brands, have recently undertaken re-franchising initiatives in recent years.
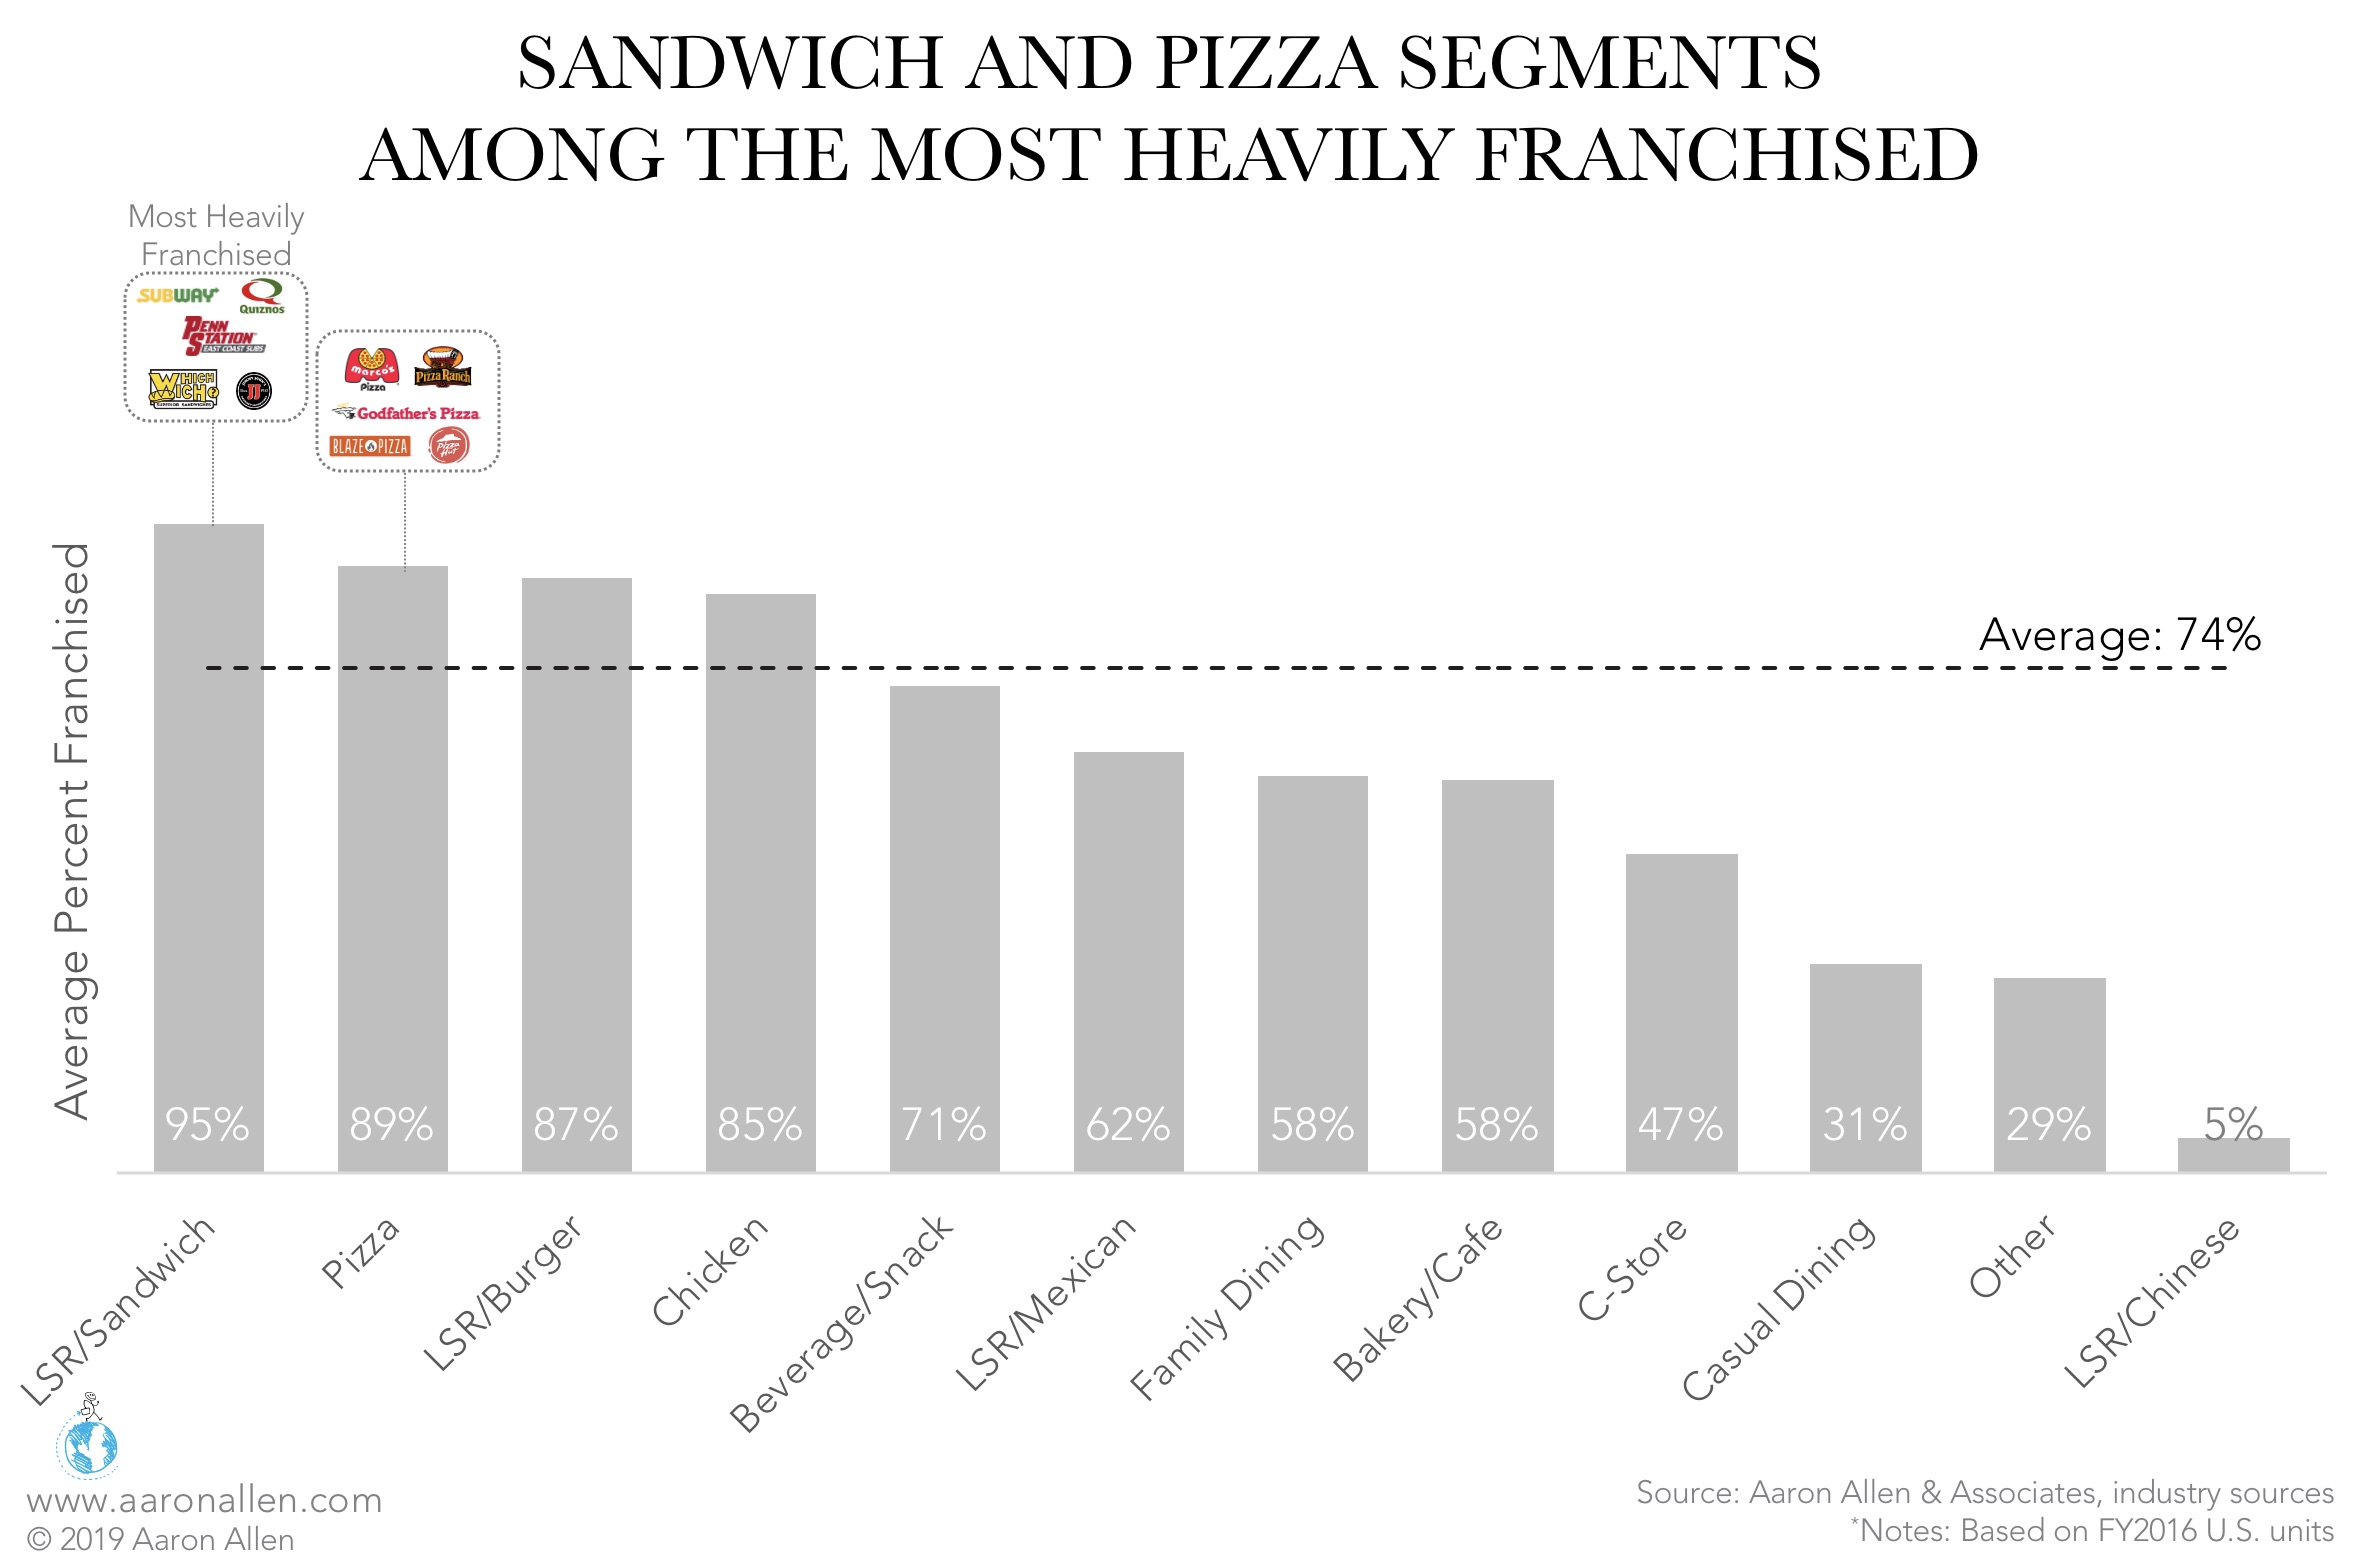
Many chains derive part of their revenue from corporate store sales and part from franchise fees. Among the top 200 U.S. chains, franchising levels by segment range from 5% of the system (LSR Chinese) to 95% (LSR Sandwich and Pizza chains such as Subway, Jimmy John’s, Domino’s, and Pizza Hut).
Restaurant royalties range between 3.5% and 10% of the franchisee’s sales.
Franchising is often seen as an attractive growth strategy because of the lower capital requirements for the franchisor relative to build-out costs, as franchisees pay the hard costs of restaurant openings. Oftentimes the franchisor offers franchise financing, in which case interest payments add to the franchisor profits.
But it’s a common misconception that franchises can — or should — be sold as soon as there is interest. Part of the challenge for franchisors is in realizing that it’s almost a completely separate business to sell and support those units than managing corporate locations.
In restaurants, F&B costs or COGS (Cost of Goods Sold) typically represent about 30% of sales. For coffee and snack chains, however, food costs can be much lower.
Many restaurant chains have learned the importance of tracking food commodities the hard way, when disease or a shortage of a particular commodity have sent prices soaring. In 2013, for instance, Darden saw its food and beverage costs rise six percent (outpacing an increase in sales) in the wake of a disease affecting Asian shrimp.
Food costs are such a large burden for restaurants that rising commodity prices can directly (and dramatically) impact a company’s bottom line. Even modest increases in commodity prices can require restaurant operators to re-engineer their operating costs and, often, even their menus.
Menu engineering and performance optimization can help lower food costs without affecting quality. The gross profit margin is usually calculated as revenue minus COGS.
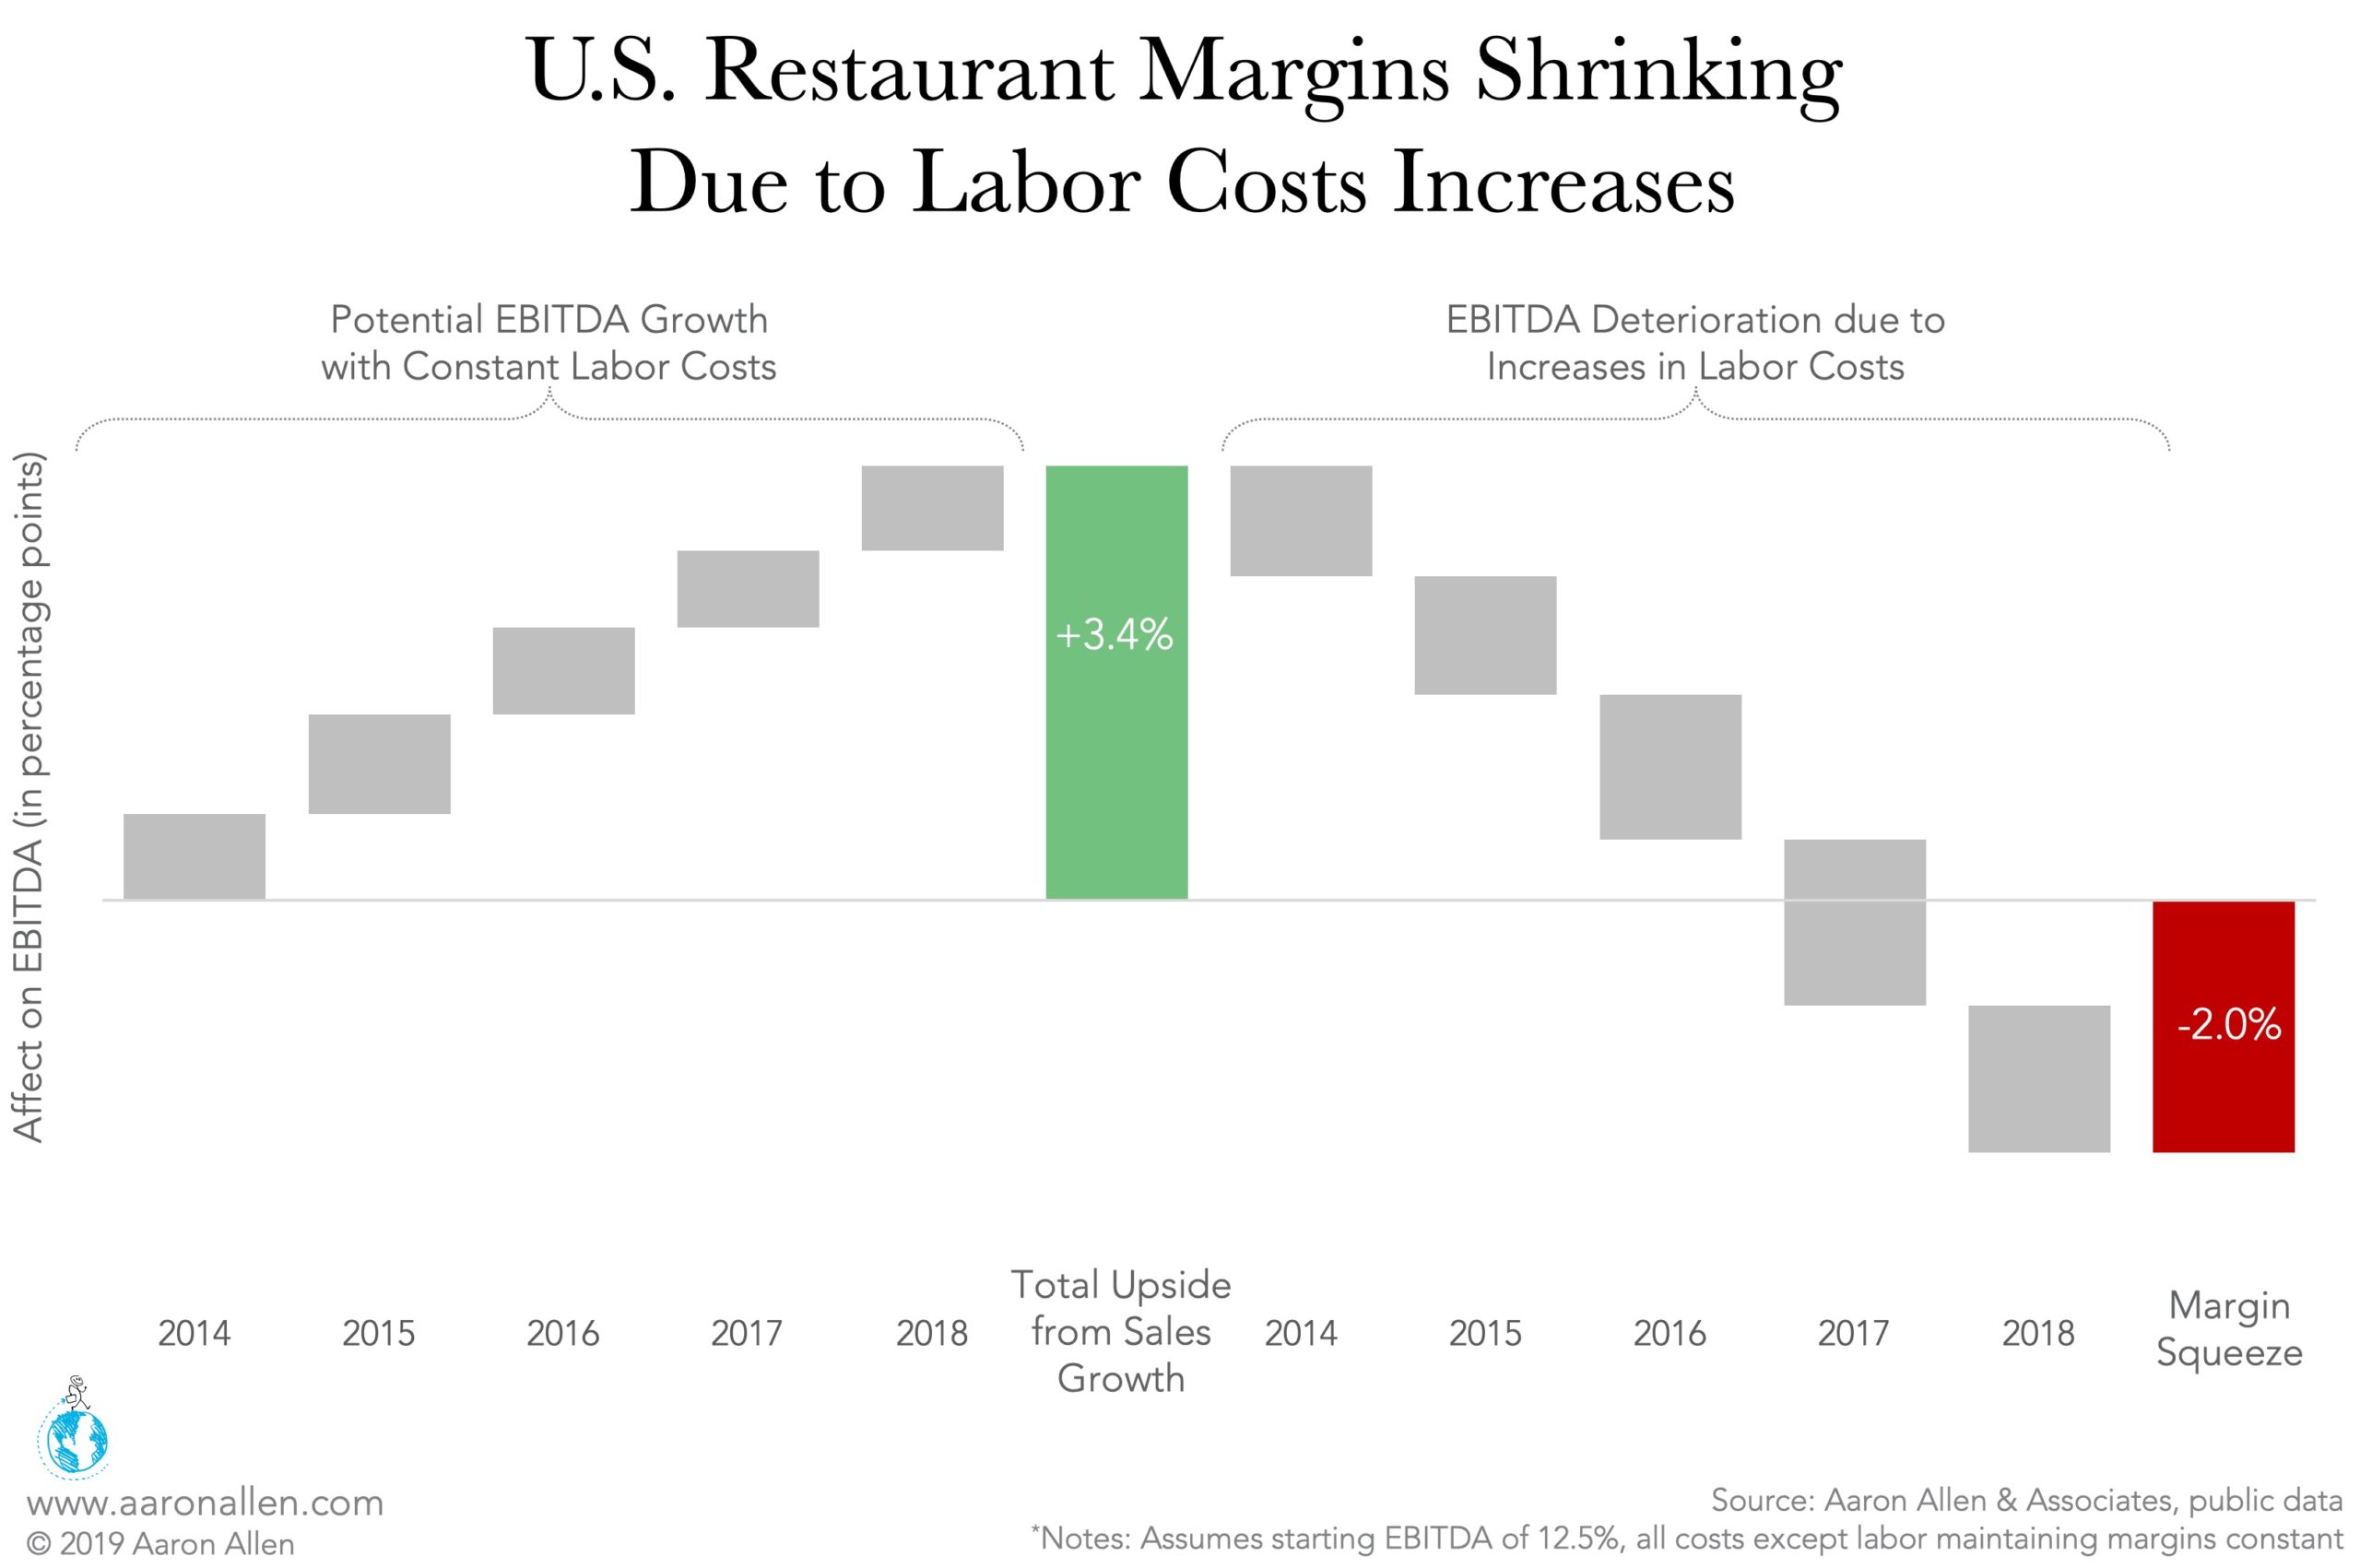
Labor has increasingly become the biggest pain point for operators in the restaurant industry. These are, broadly, the costs involved in people producing and serving food at the restaurant, including payments to food preparation workers, cooks, servers, first-line supervisors, and managers. In the U.S. the average hourly wage has been consistently climbing since 2011 and it’s close to $16/hour as of 2021.
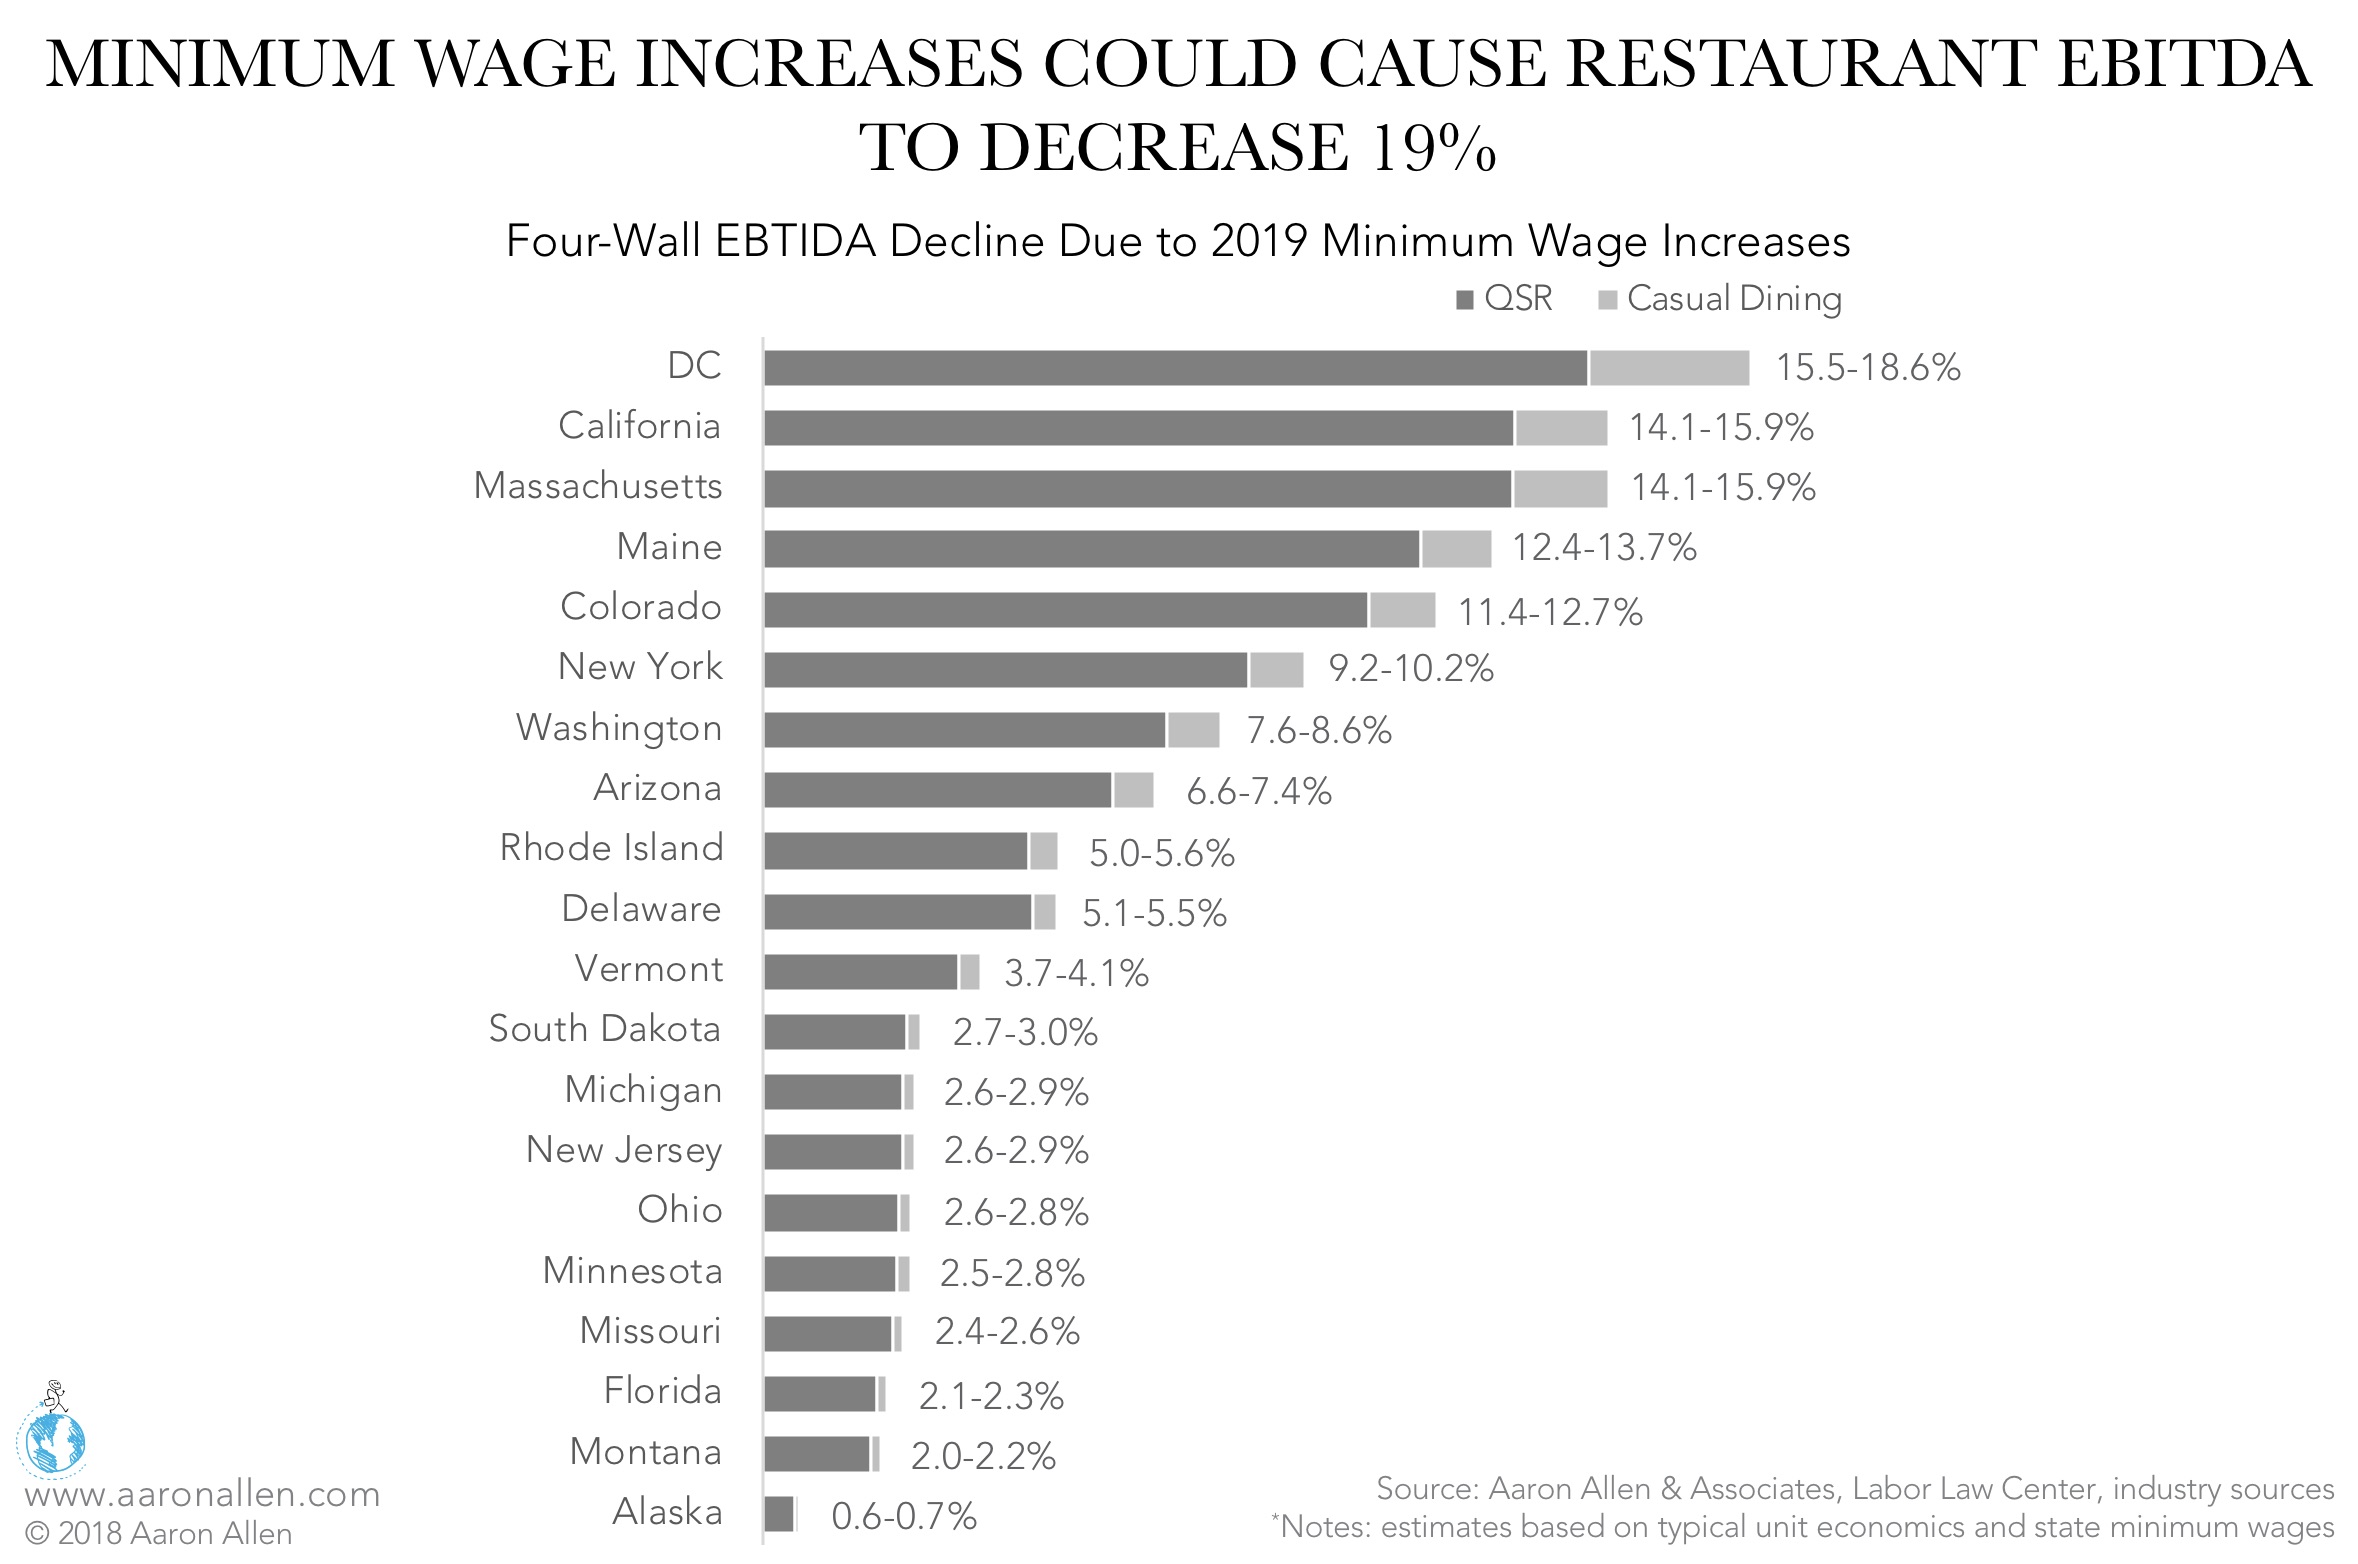
Increases in minimum wages are creating significant cost increases for restaurants (payroll typically represents about 30% of sales), which could see declines of up to 19% of four-wall EBITDA margins. Because of the type of service, full-service restaurants typically have higher labor costs than QSR and fast-casual.
A fine line exists between overstaffing a restaurant and scheduling enough employees to run it effectively. Sensible scheduling and employee productivity KPIs are the best ways to control the cost of labor. In addition, tools should be available to assess mid-shift needs. Restaurant financial analysis can review payroll reports, sales reports, and customer counts to optimize scheduling and productivity and to decrease the cost of labor.
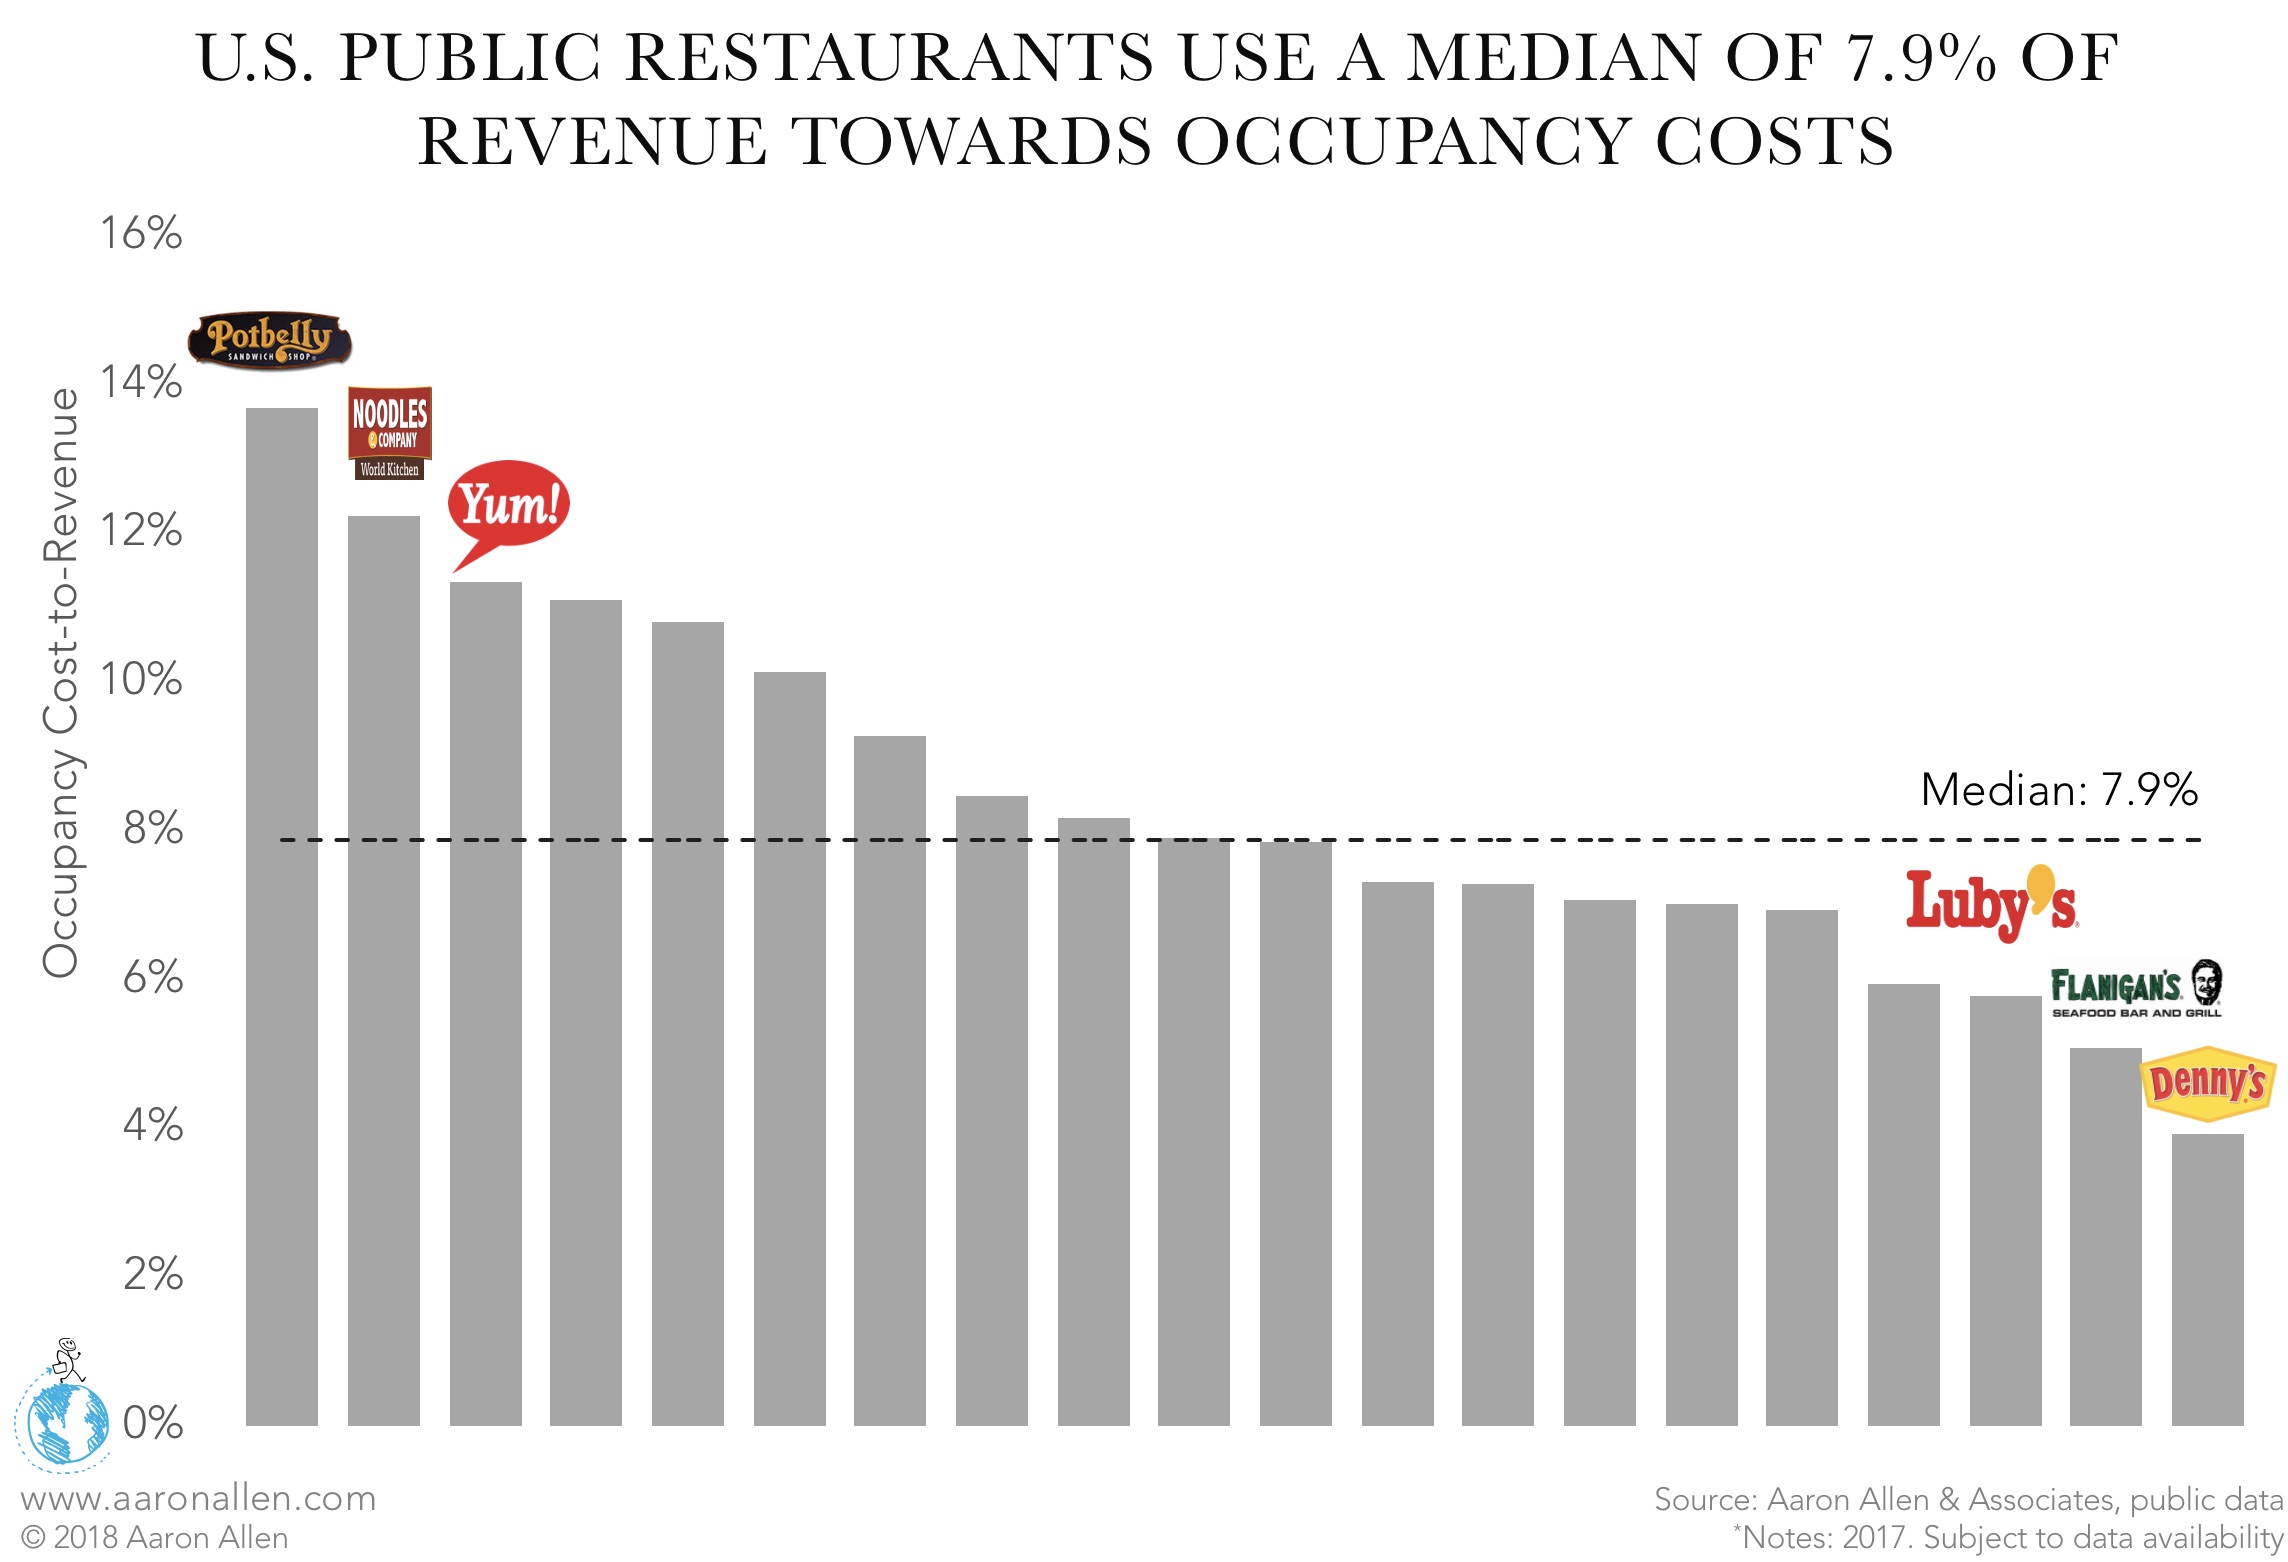
Restaurant rent usually takes around 8% of sales but it’s not unusual for some chains to have large swings between high-traffic and low-traffic locations. Location strategy is key to optimize occupancy costs, especially when opening a restaurant.
Earnings Before Interest, Taxes, Depreciation, and Amortization, or “EBITDA”, is a measure of restaurant profitability that strips out the cost of capital investments. It’s often used as a more precise measure of profitability than Net Income because it excludes the influence of adjustments that can take place via taxes and interests. Many operators and owners view restaurant EBITDA as a useful way of evaluating the actual earnings power of their operation, and to compare their businesses to others carrying different debt levels or depreciation values.
During pre-Covid times, U.S. restaurant EBITDA benchmarks were around 13% of revenue (as a median based on publicly traded restaurants). However, in 2020, EBITDA margin reached a median of only 5%. The highest EBITDA margins correspond to highly franchised QSR chains: McDonald’s, Restaurant Brands International (parent to Burger King, Popeyes, and others), and Yum! Brands.
By subtracting Depreciation & Amortization, Interest Expense, Non-Operating/Unusual expenses (if any), and Taxes, the EBITDA margin for publicly traded restaurants is reduced from a median of 5% in 2020 to a profit margin (Net Income-to-Revenue) of 2%.
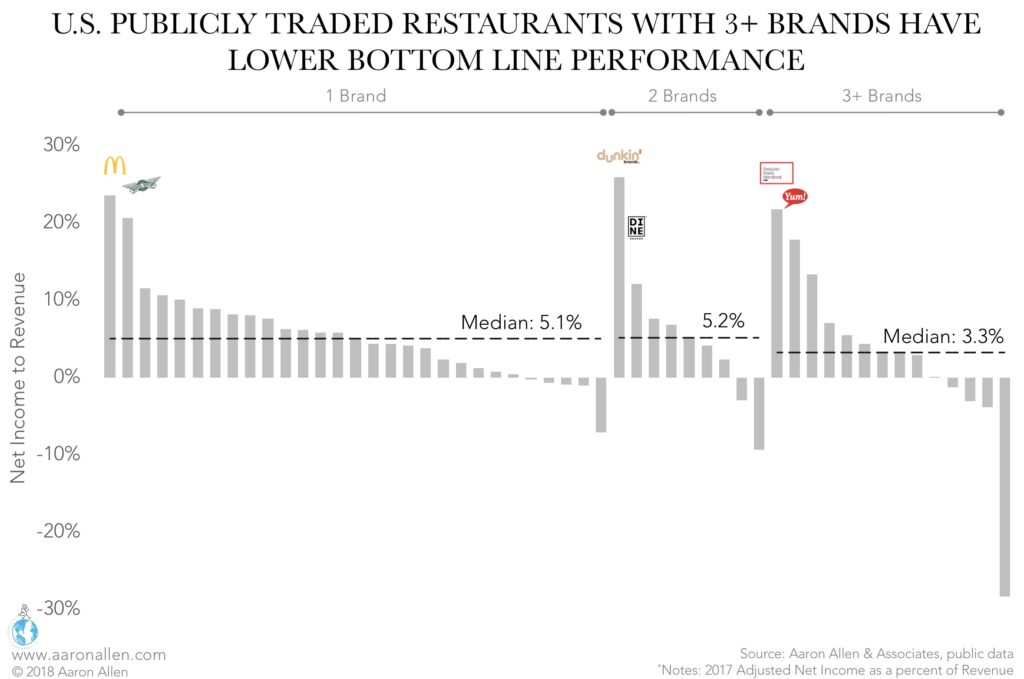
Companies with fewer brands (often franchisors) were more profitable, with median bottom lines more than 50% higher. SG&A and other expenses seem to be adding up in tandem with the number of brands. There are several ratios that use the Net Income in their calculation, including EPS (Earnings Per Share) and Return on Assets.
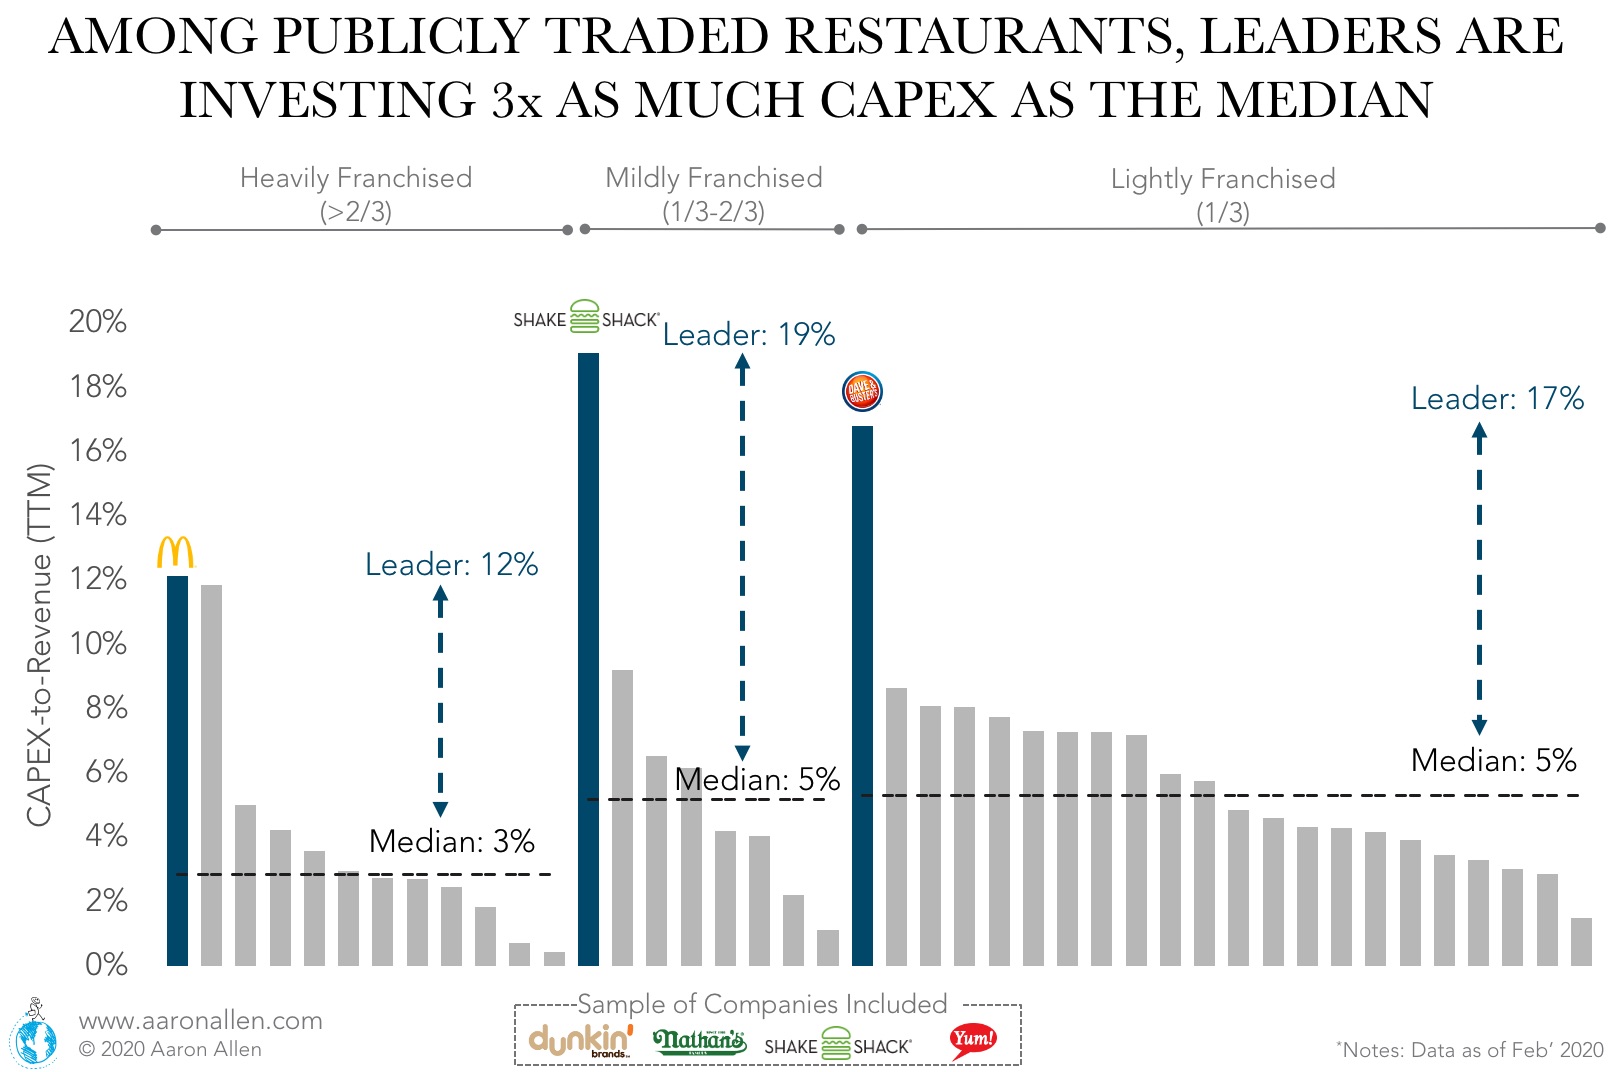
Capital expenditures are funds allocated to investments in equipment, property, technology, IP, or other assets.
Restaurant CAPEX benchmarks reach an overall median of 3% (based on public companies as of 2020) though is higher than 5% of revenue for the top quartile. Leaders are investing at least three times as much in CAPEX (as a percent of revenue) as the median. While the majority of businesses are decreasing CAPEX investments and debating over where they should be allocating funds — whether to infrastructure improvements or buybacks or dividends — market share winners are gaining traction with investments in guest experience enhancements, technology, infrastructure, and other competitive moat-building strategies.
A simple calculation: Current Assets + Non-Current Assets
This includes Cash and Cash Equivalents, Accounts Receivable, Inventory, and Pre-Paid Assets.
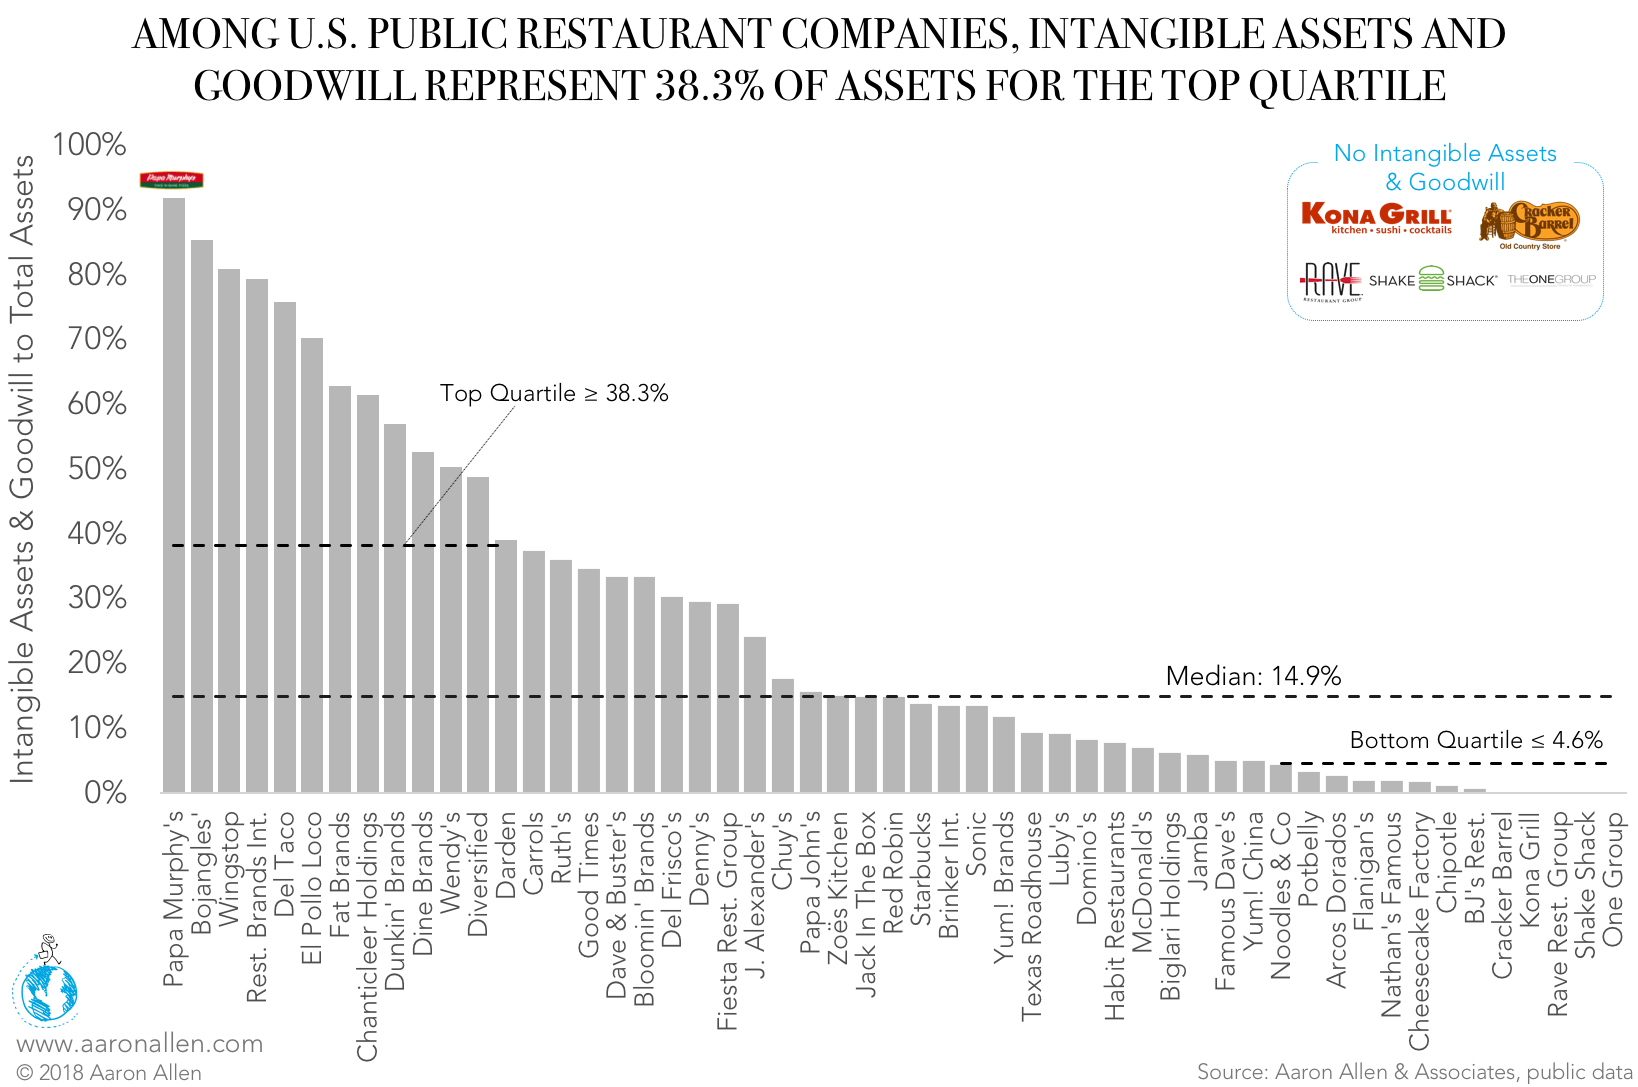
This includes Property, Plants, and Equipment (PPE), Goodwill, Other Intangible Assets, Non-Current Note Receivables, Non-Current Pre-Paid Assets.
Another pretty simple calculation: Total Liabilities = Current Liabilities + Non-Current Liabilities.
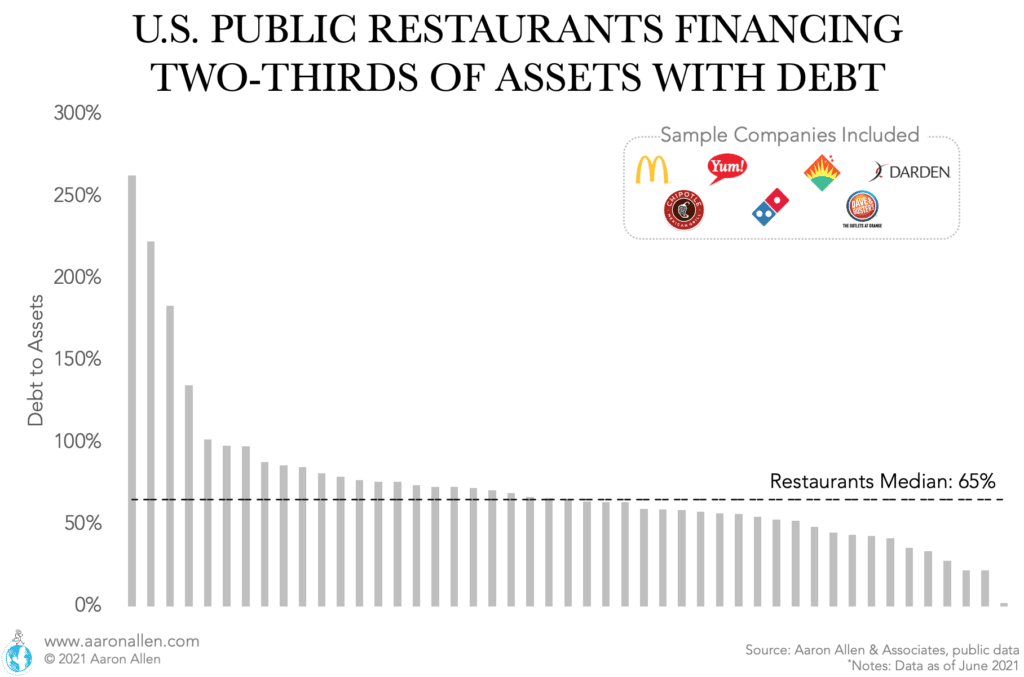
With many companies having to take on more debt in the face of COVID shutdowns, it’s not surprising that the median Debt to Assets ratio for publicly traded restaurants in the U.S. reaches 65% (meaning close to two-thirds of assets are financed with debt rather than equity).
This includes Payables and Accrued Expenses, Current Debt and Capital Lease Obligations, and Other Current Liabilities.
This includes Long-Term Debt and Capital Lease Obligations and Non-Current Deferred Liabilities such as Taxes.
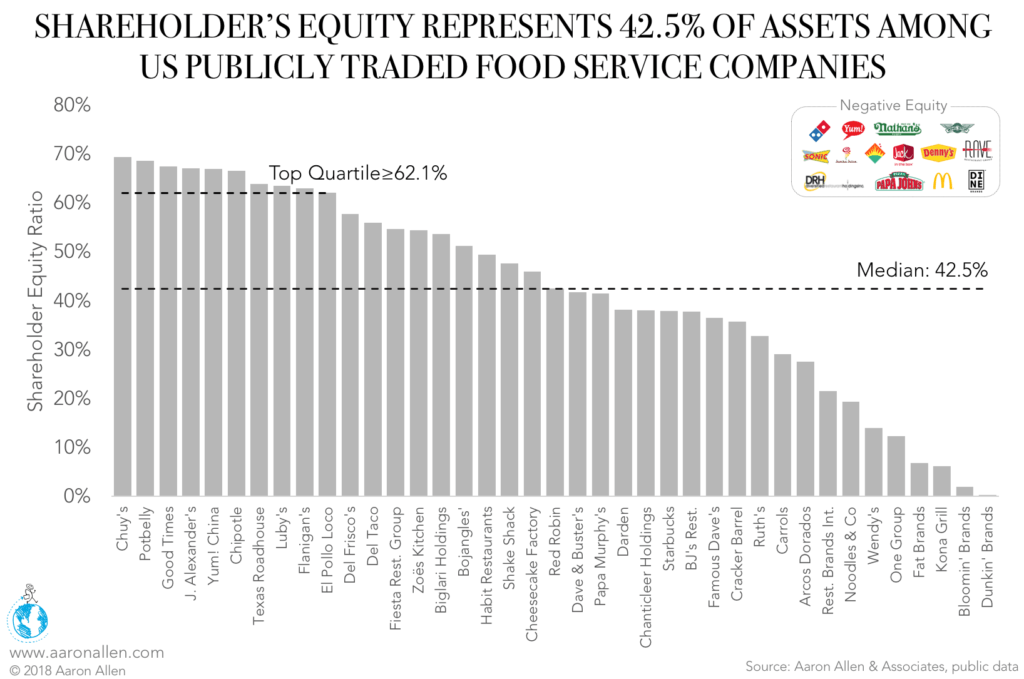
As a median, U.S. publicly traded restaurants have 42.5% of assets financed by equity (as of 2018). For the top quartile, equity reaches 62.1% of assets or more, indicating that they are more often locked up with debt than equity.
This metric indicates the company’s long-term capability to generate profits. It’s an indicator based on earnings from continuous operations, providing an accurate picture of the company’s ability to meet debt obligations (excluding any unusual operations).
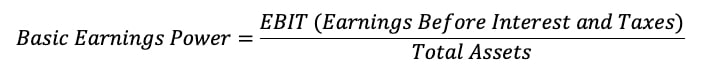
For every $100 dollar invested in assets, restaurant chains in the U.S. and Asia generate more than $8 in EBIT (earnings before interest and taxes) as a median. The effectiveness for generating profit margins is not as high in Europe, where the Basic Earnings Power is $5 (per $100 invested in assets).
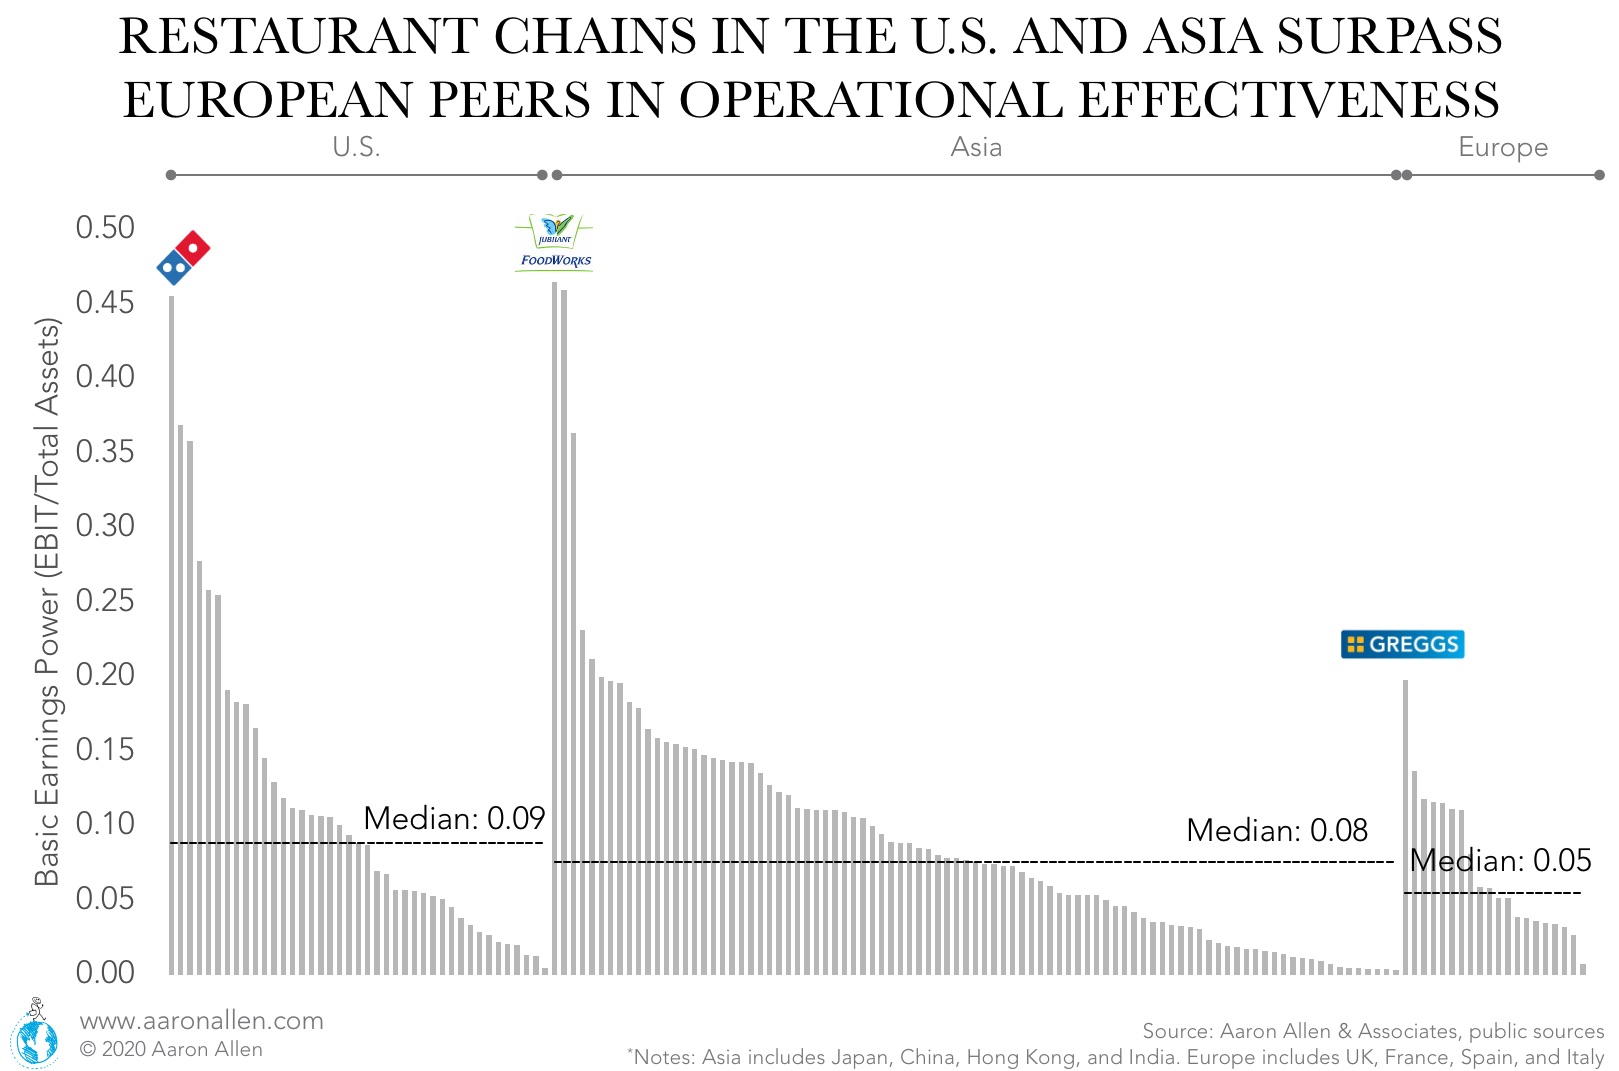
Earnings Per Share are another way to measure restaurant profit margins. U.S. publicly traded restaurant companies have a median basic Earnings Per Share of $1.0 (as of 2017). The top quartile, however, reaches more than twice as much, and some companies -like limited service Domino’s, Chipotle, McDonald’s, and Casual Dining Cracker Barrel and Biglari Holdings have EPS higher than $5. There is a large swing as well. The difference between 2017 maximum (Biglari Holdings with an EPS of $40.8) and minimum (Dine Brands with an EPS of -$18.3) was close to $60.
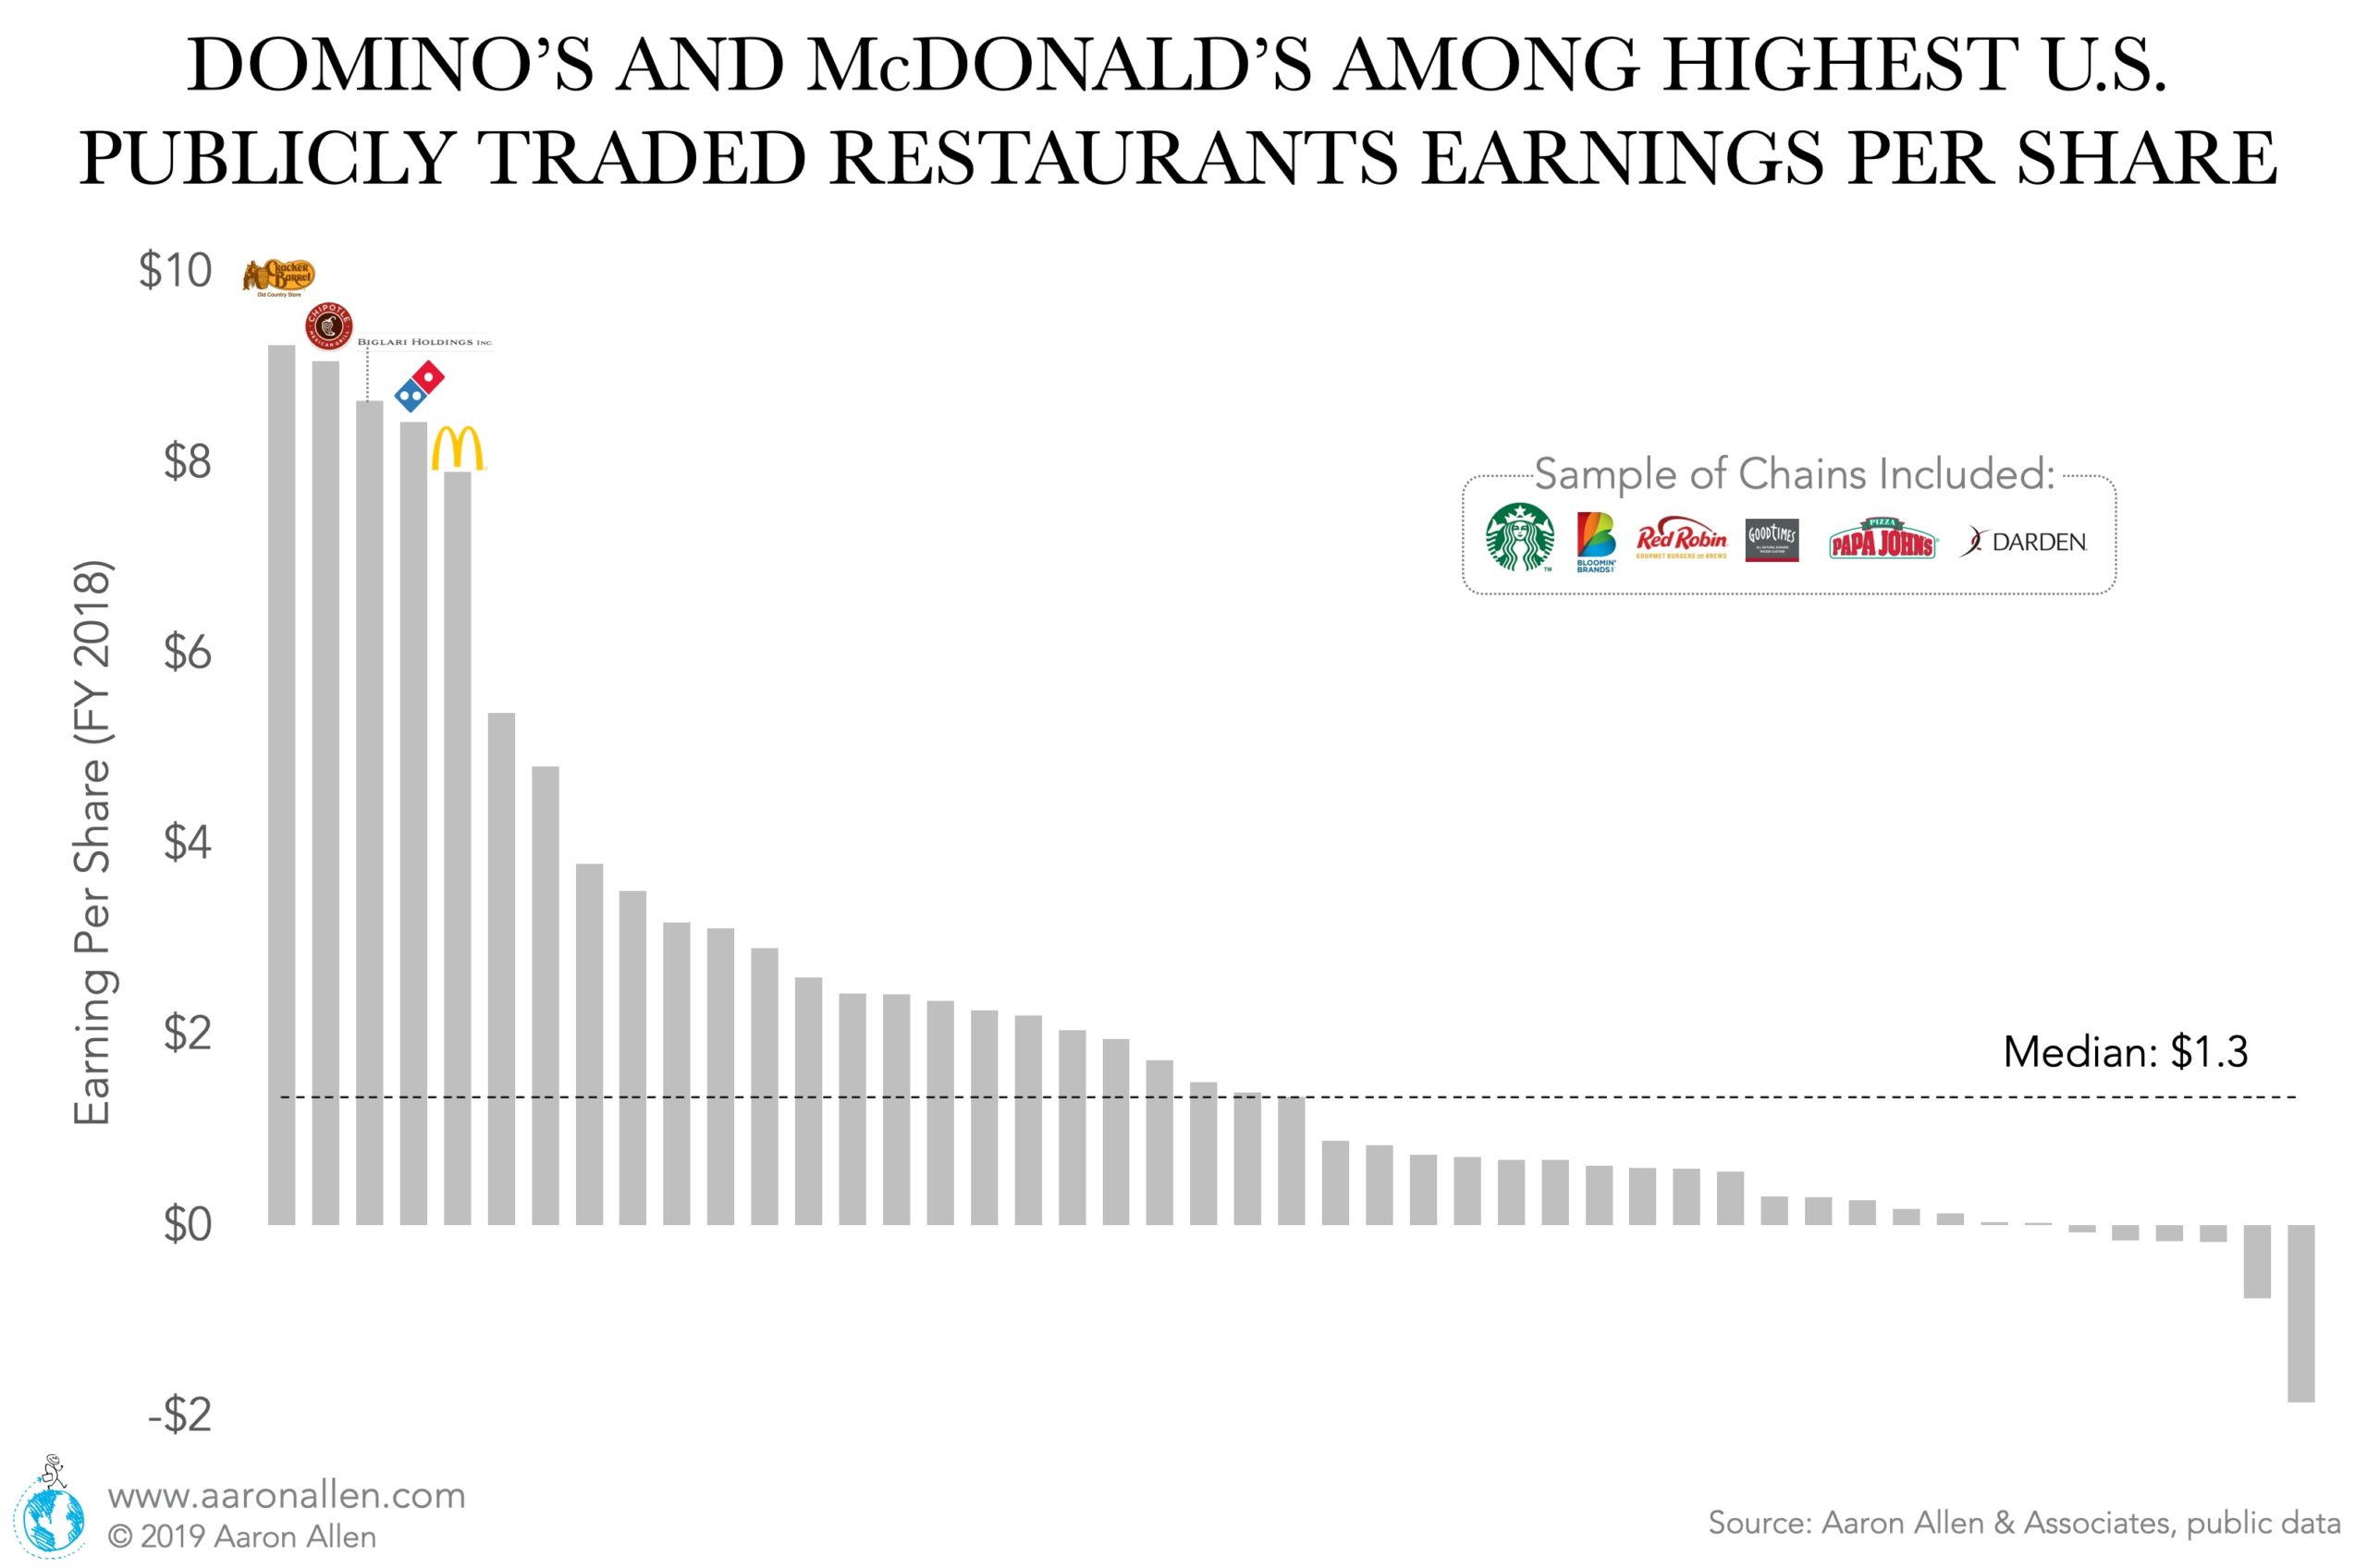
Leverage can be a relevant tool to finance restaurant growth, and many chains are able to find sustainable ways to use restaurant loans. In the restaurant industry, the median Debt Ratio as resulting from balance sheets (debt as a percentage of assets) for U.S. traded companies (public and OTC) is 0.70 – meaning debt is equivalent to 70% of total assets. With interest rates still at historically low levels, it is a good time to assess options for financing the business, obtaining new lines of credit, and refinancing (or evaluating existing or potential partnerships). Being prepared for what questions lenders and investors will ask (from “Does the company have an optimized portfolio?” to “How are investments in technology paying-off?”) is the first step to harness this opportunity era of cheap capital.
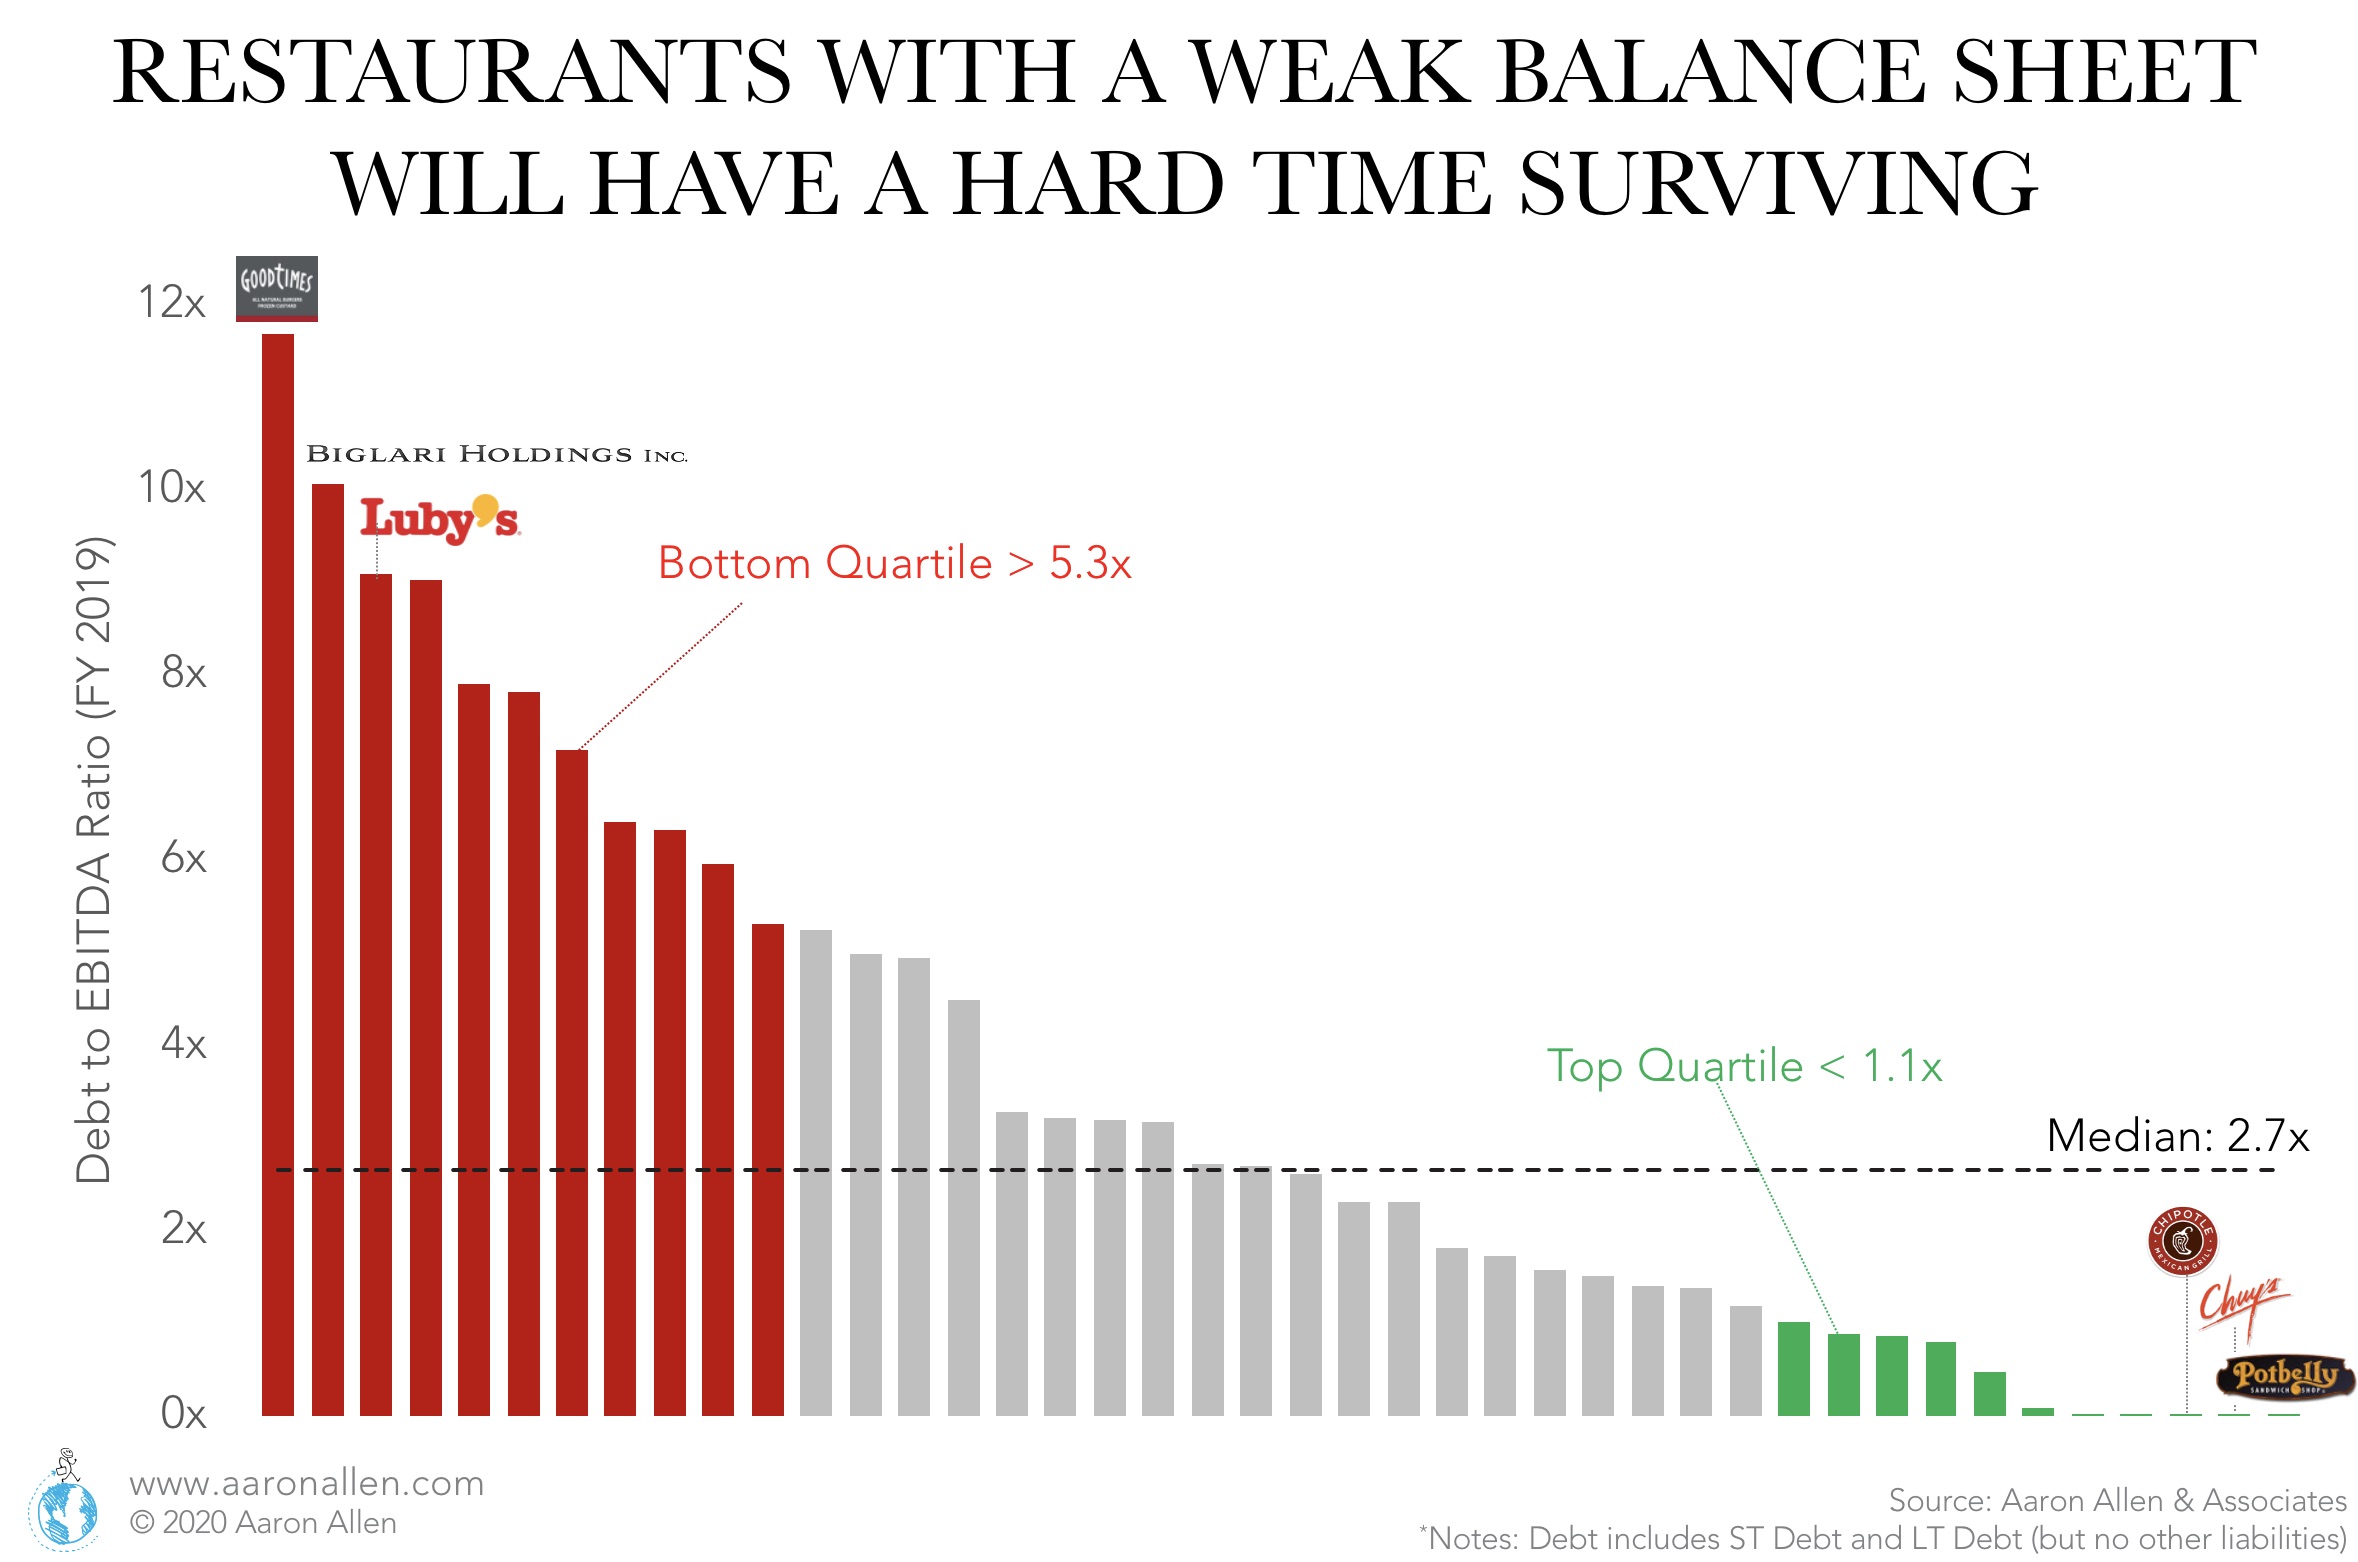
Restaurant finances show that pre-crisis, the debt-to-EBITDA ratio for the U.S. restaurant industry sat at 2.7x (as a median, based on public companies). At this rate, debt repayment would take close to three years (assuming all EBITDA is applied to debt repayment). The most susceptible companies are those in the Casual Dining segment that were hit in the last recession had relied on financial engineering to stay afloat for the last decade. Those with strong balance sheets are more likely to survive, but for those that were overextended or carrying too many restaurant loans pre-COVID crisis (and now having to make even more intense use of revolving facilities and other credit lines) are gonna be in trouble in the next 60 days. A lot will depend on the category, the company, and the value proposition. We expect a silver lining to come in Q3 for operators and investors who can weather the storm through the balance of Q2.
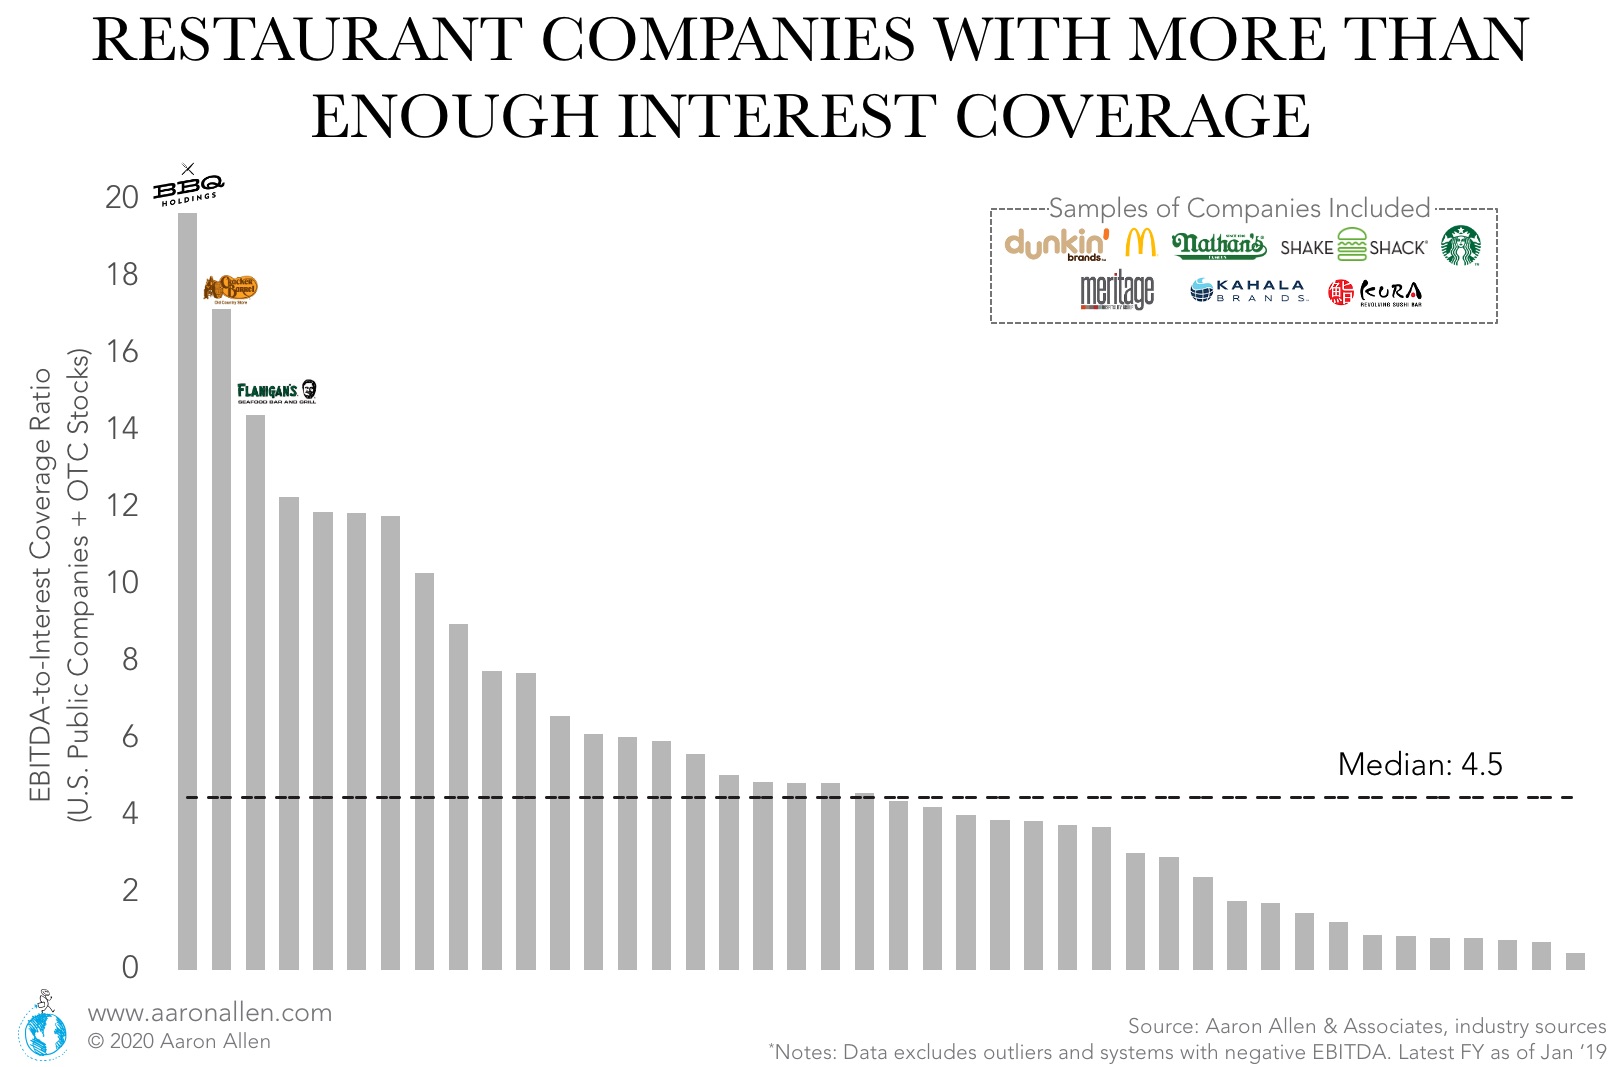
As a median, restaurant companies trading in the U.S. have a 4.5 interest coverage ratio (4.5 times as much EBITDA as needed to cover interest payments).
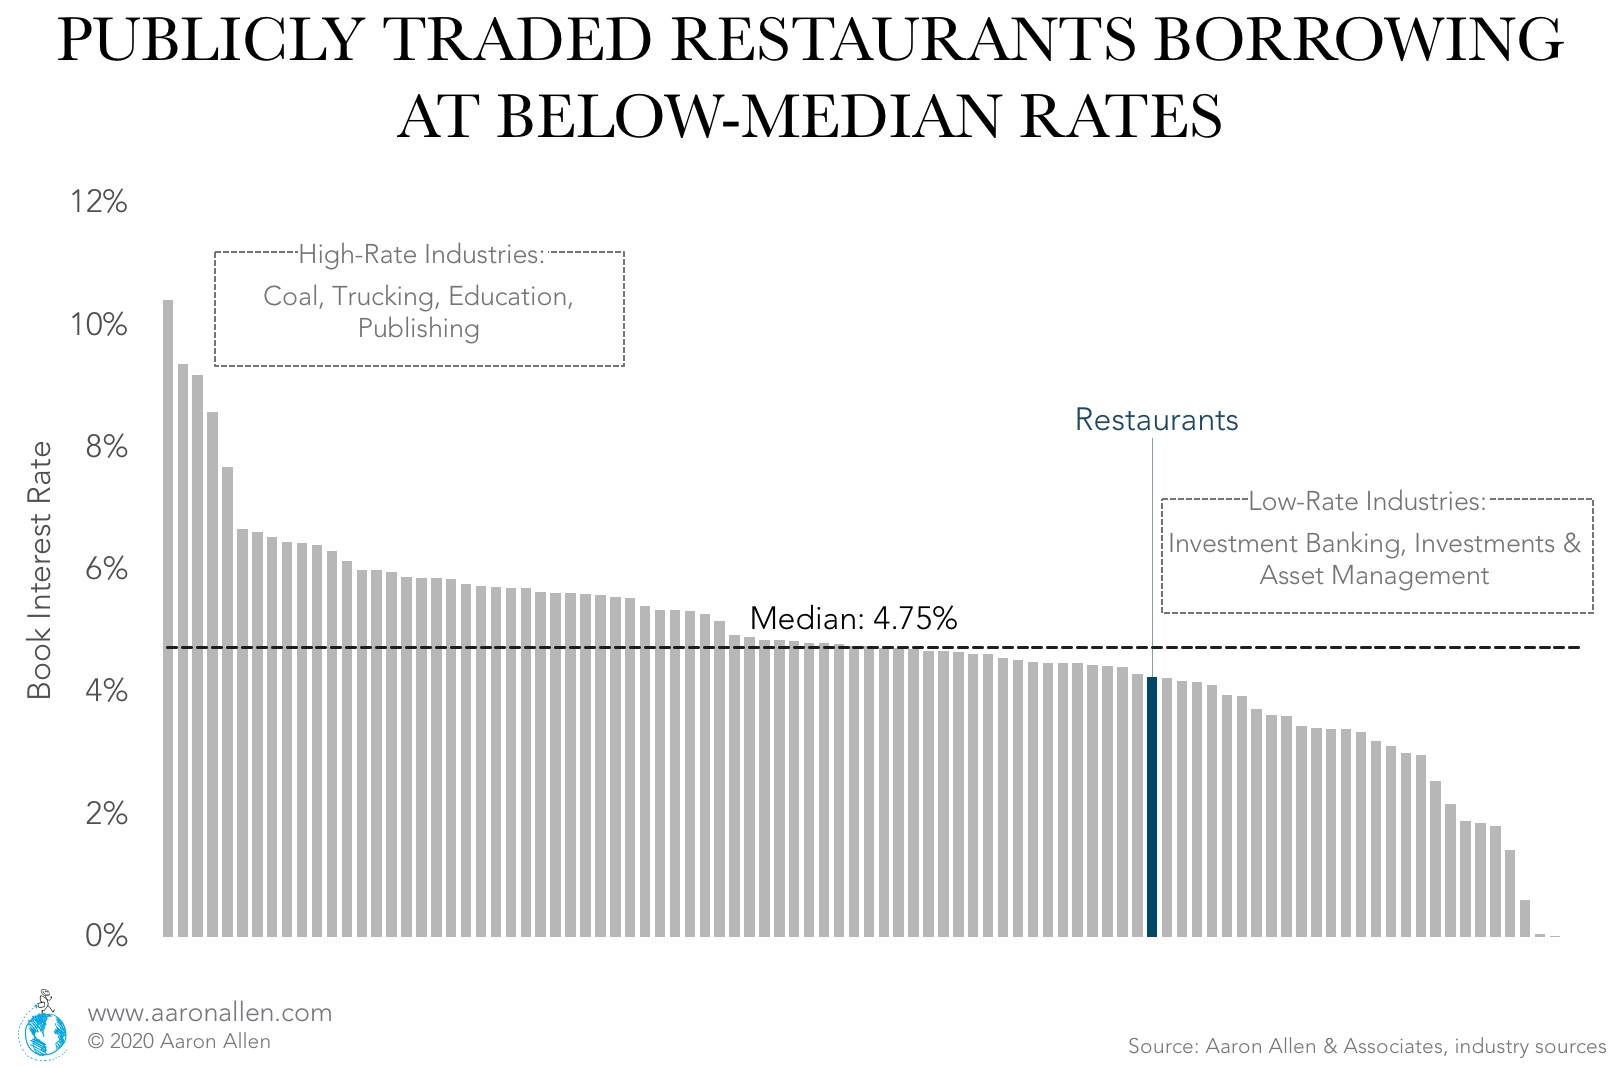
There is large variability in the interest rates paid by industry, and restaurants are below the median. Book interest rates average 4.25% for restaurants, while the median for close to 100 industries in the U.S. reaches 4.75%. In the same way that there is large variability among industries, there are large swings within the foodservice industry.
Chains paying high interest rates could get additional percentage points in Net Income by refinancing debt at a lower rate (some of the materials that would be requested prior to refinancing would be CPA-prepared historical financials, detailed explanation of deal sources and uses, ownership and management team bios, a store location list, etc.).
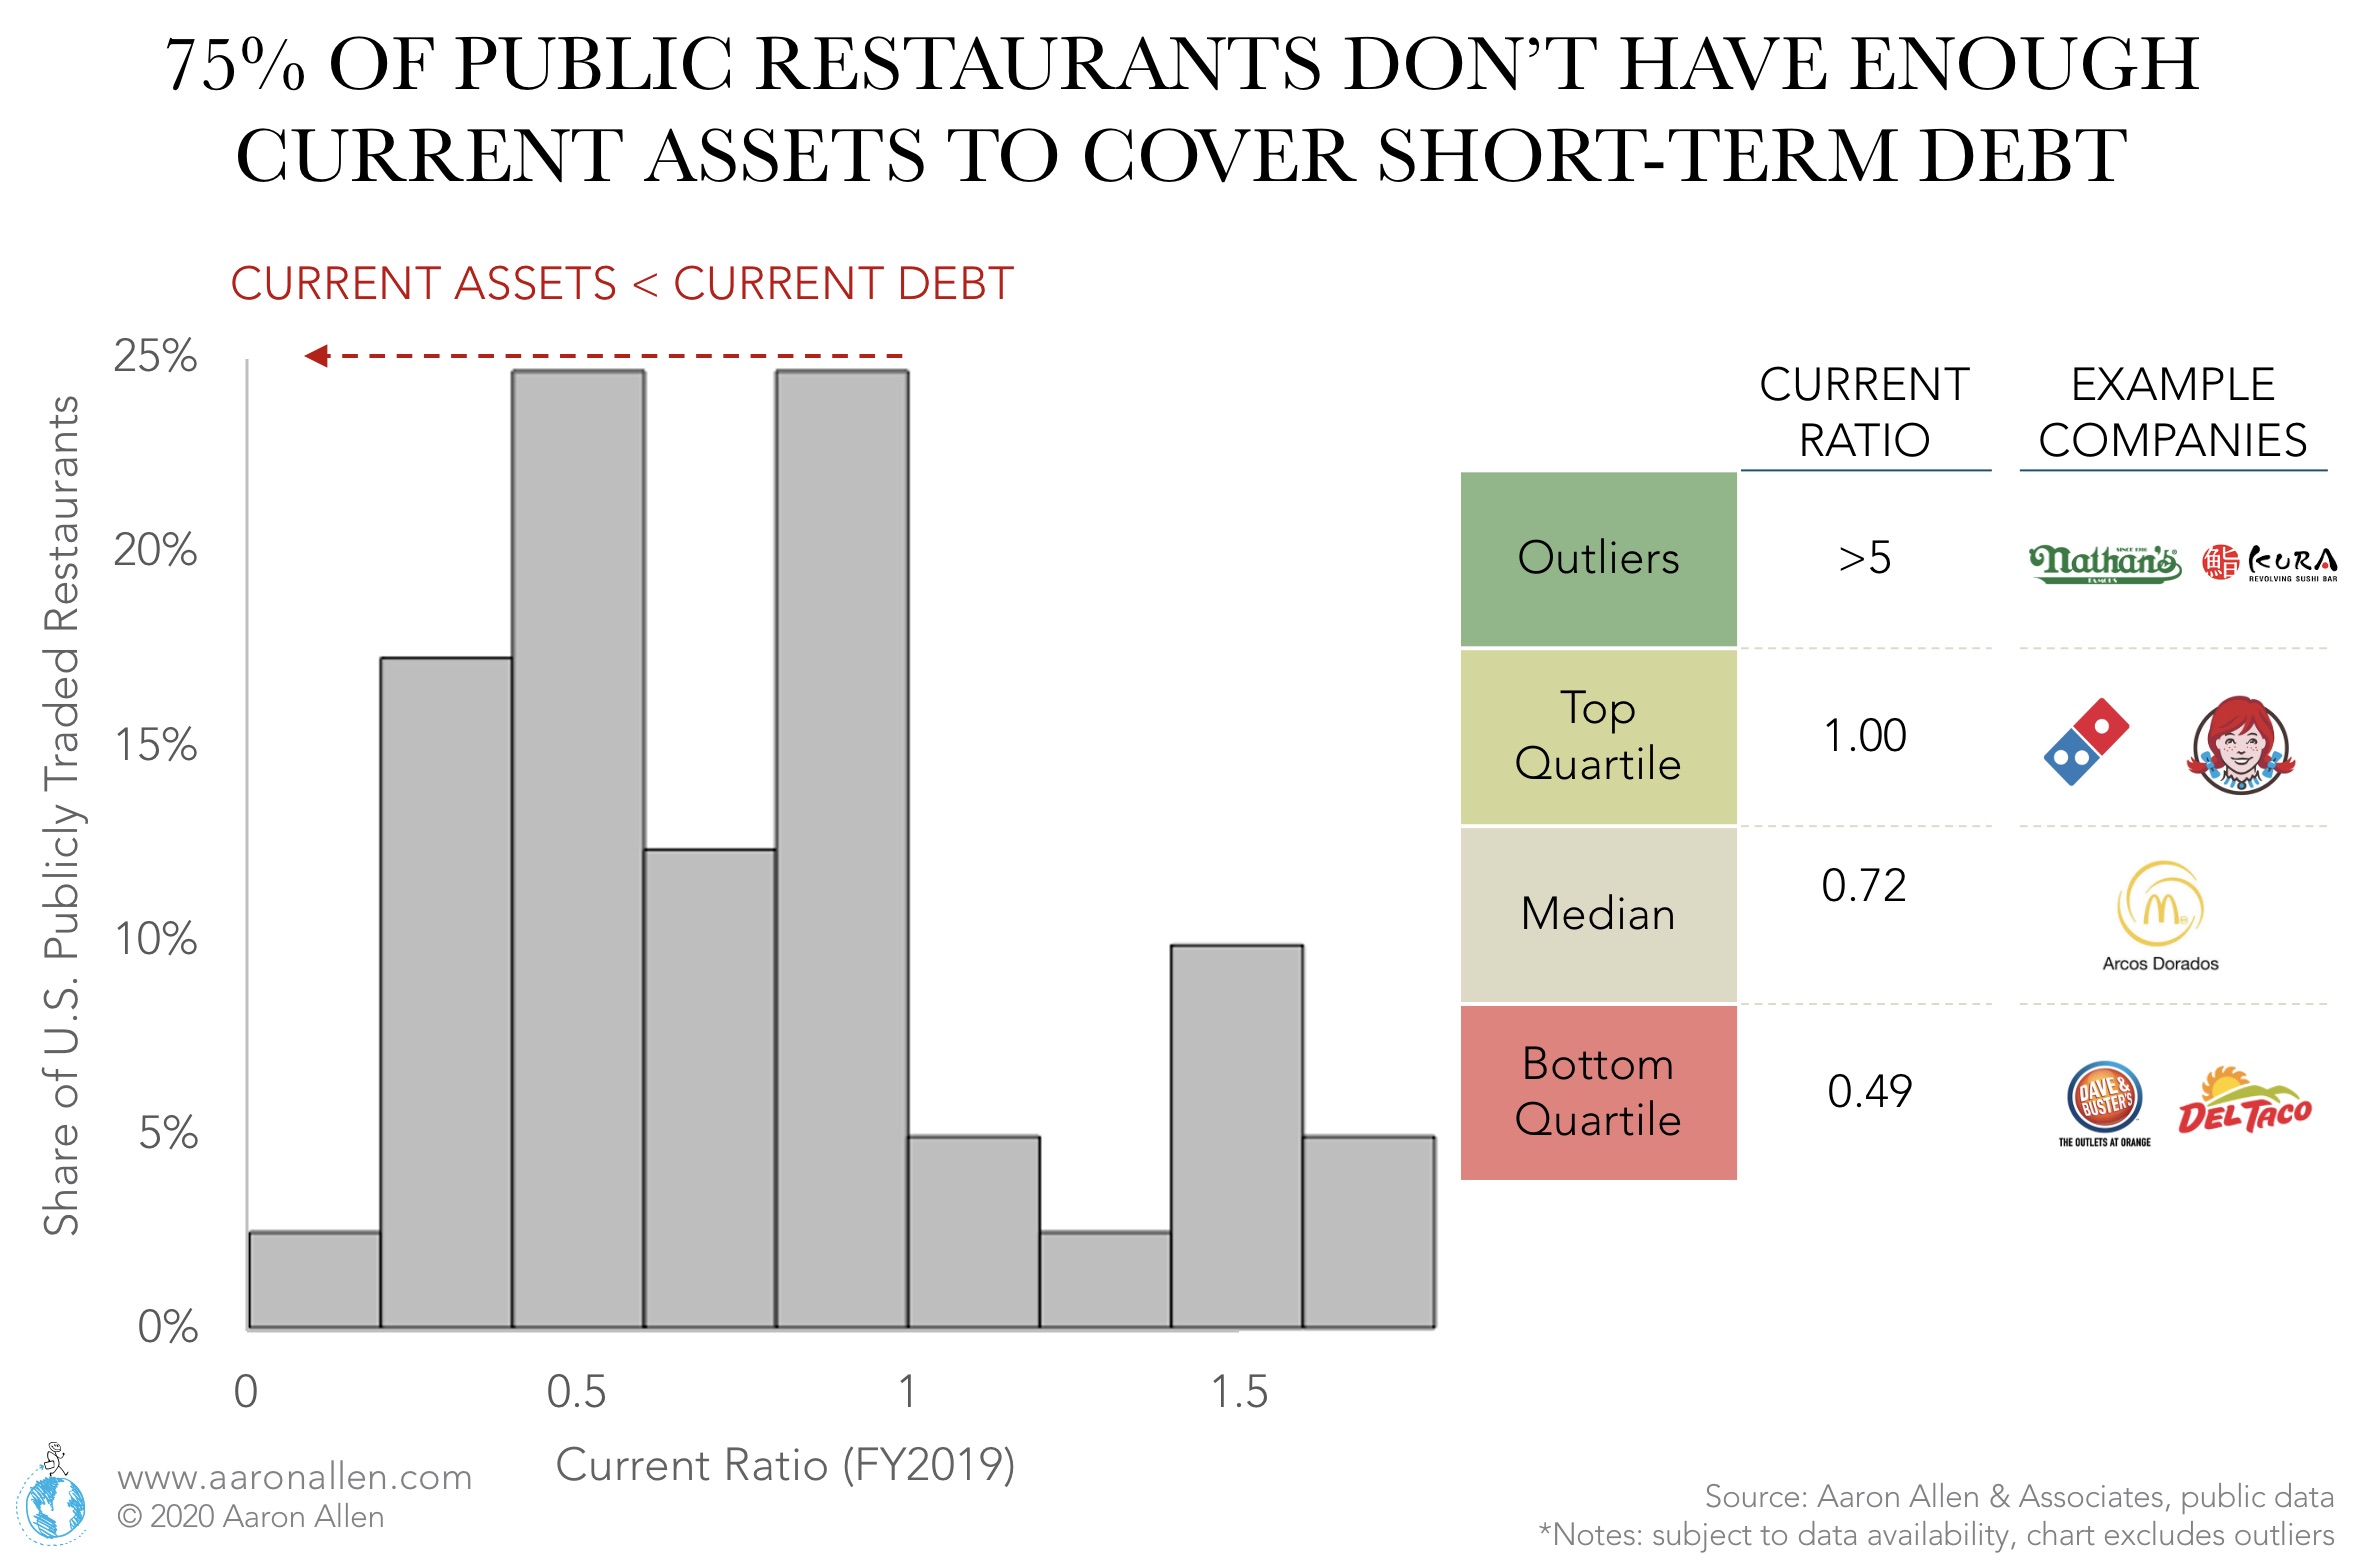
The current ratio (calculated as current assets to current liabilities) is one of the most common metrics in restaurant finance, particularly related to liquidity. The higher the current ratio, the greater the ability for a company to pay short-term loans. Current Assets include: Cash and Short-Term Investments, Accounts Receivable, Inventories, and Other Current Assets. They exclude fixed assets. Current Liabilities include: Short-Term Debt and Current Portion of Long-Term Debt, Accounts Payable, Income Tax Payable, and Others.
In the restaurant industry, the current ratio reached a median of 0.72 (FY 2019 for publicly traded companies in the U.S.) and for three-quarters of the industry, the current assets are not enough to cover all short-term debt. Some foodservice companies in the bottom quartile had current ratios lower than 0.50 (current assets covering less than half of current debt). Restaurant owners can use these same numbers (current assets and current liabilities) to calculate the working capital.
While liquidity pumping into the economy is buying time, many restaurants won’t be able to sustain their existing debt levels or access financing options and business funding. This scenario will affect restaurant financing and likely lead to plenty of distressed restaurant assets and restaurant bankruptcies in the near future, which will spur activity as the global pause on M&A lifts as travel restrictions are loosened.
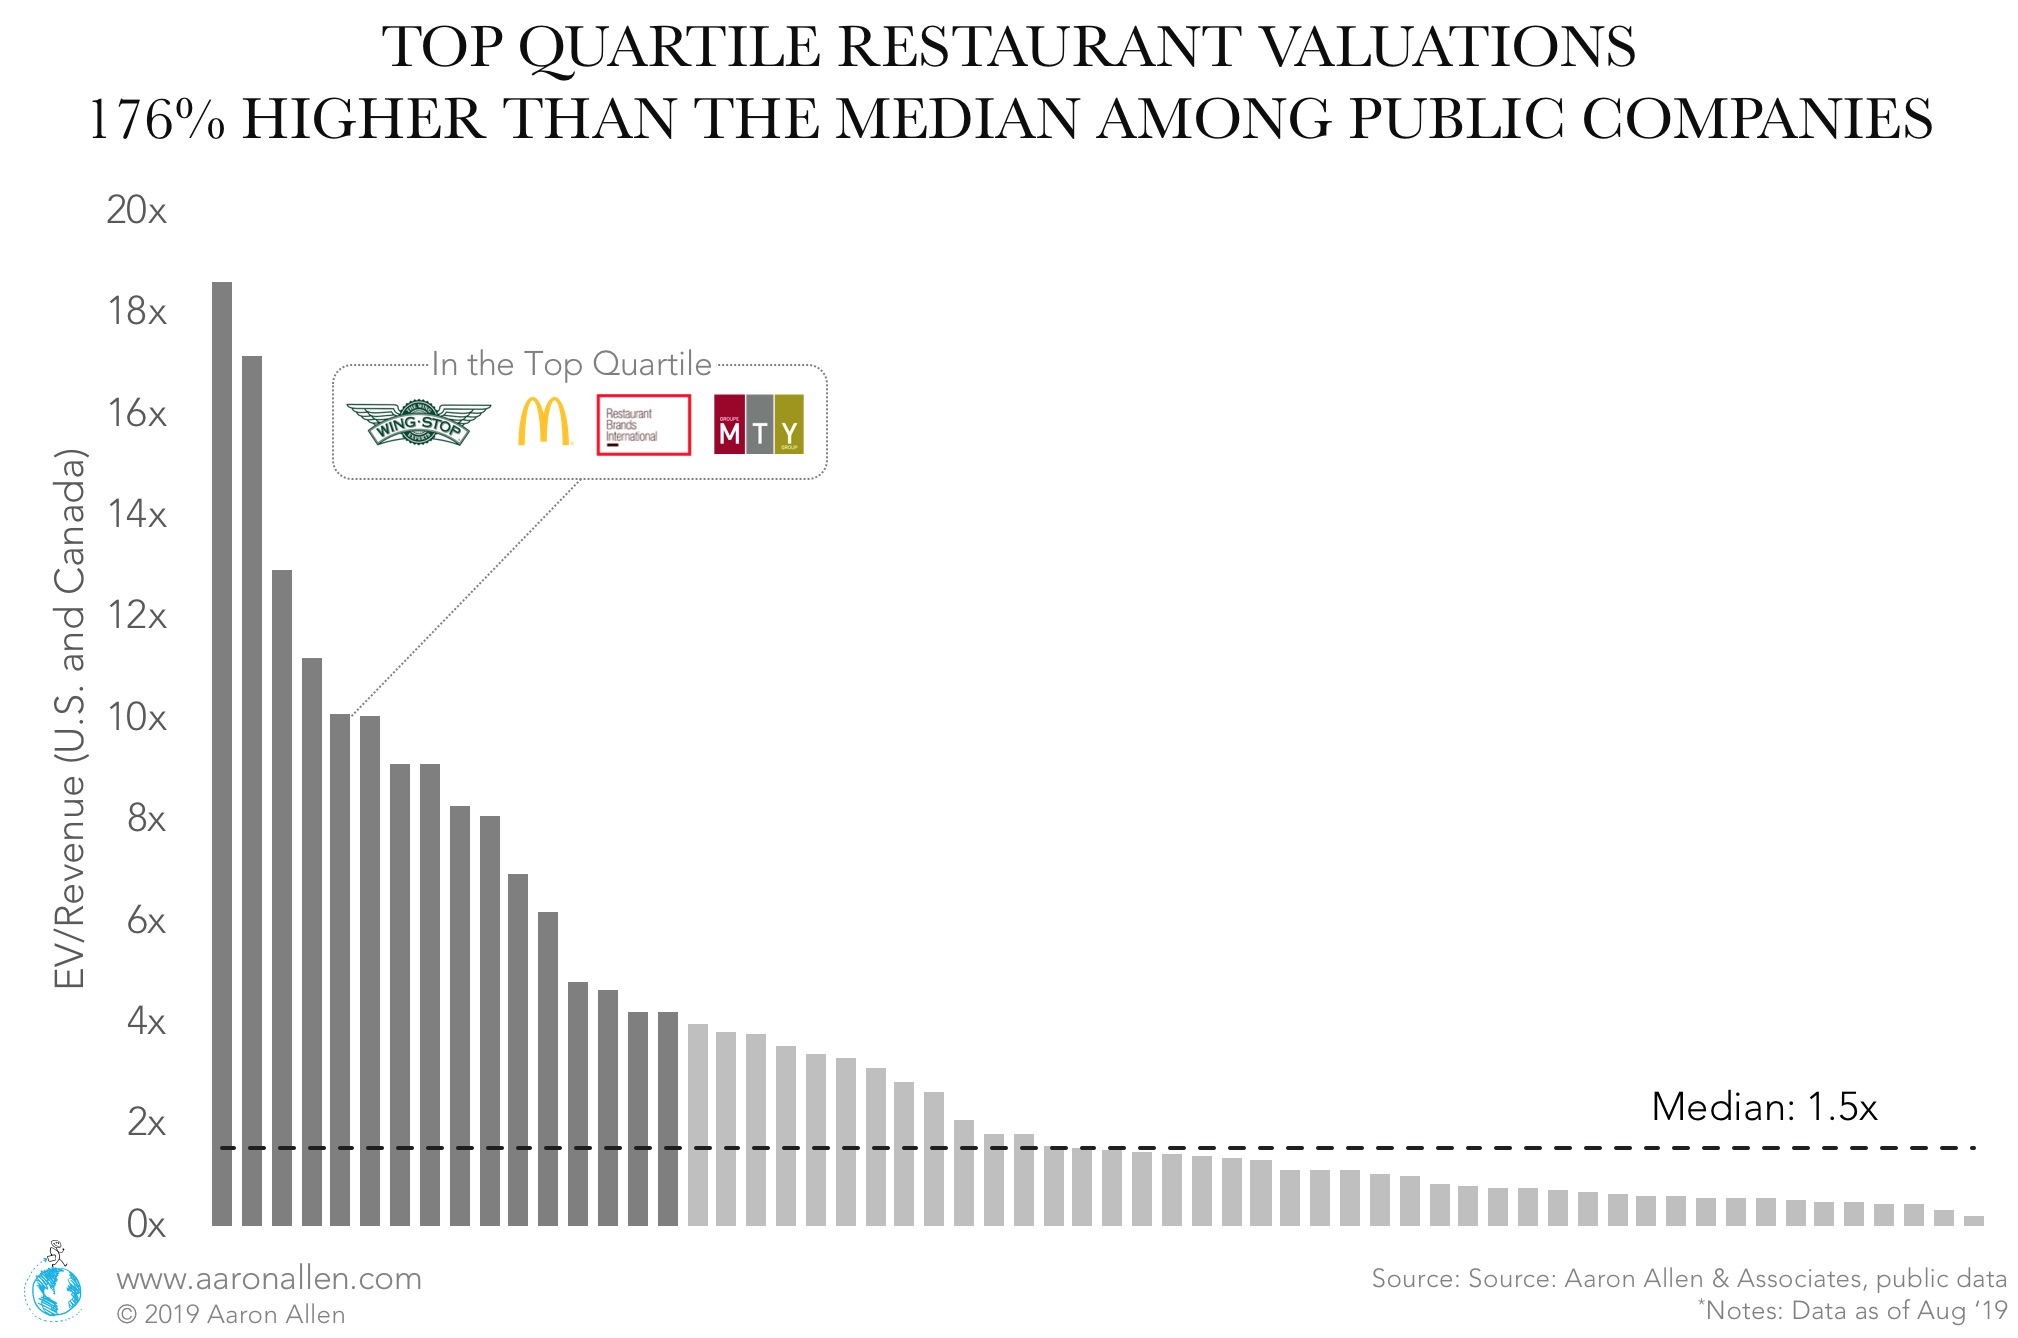
In the U.S. and Canada, the median valuation for publicly traded restaurants (measured by EV/Revenue) is 1.5x. However, the top quartile is valued at a 176% higher multiple. While supporting with both buy-side and sell-side mandates we’ve seen that valuation multiples can actually be increased during the holding period. When the right components are combined within a platform, the whole can be much greater than the sum of its parts (and this is reflected in valuations).
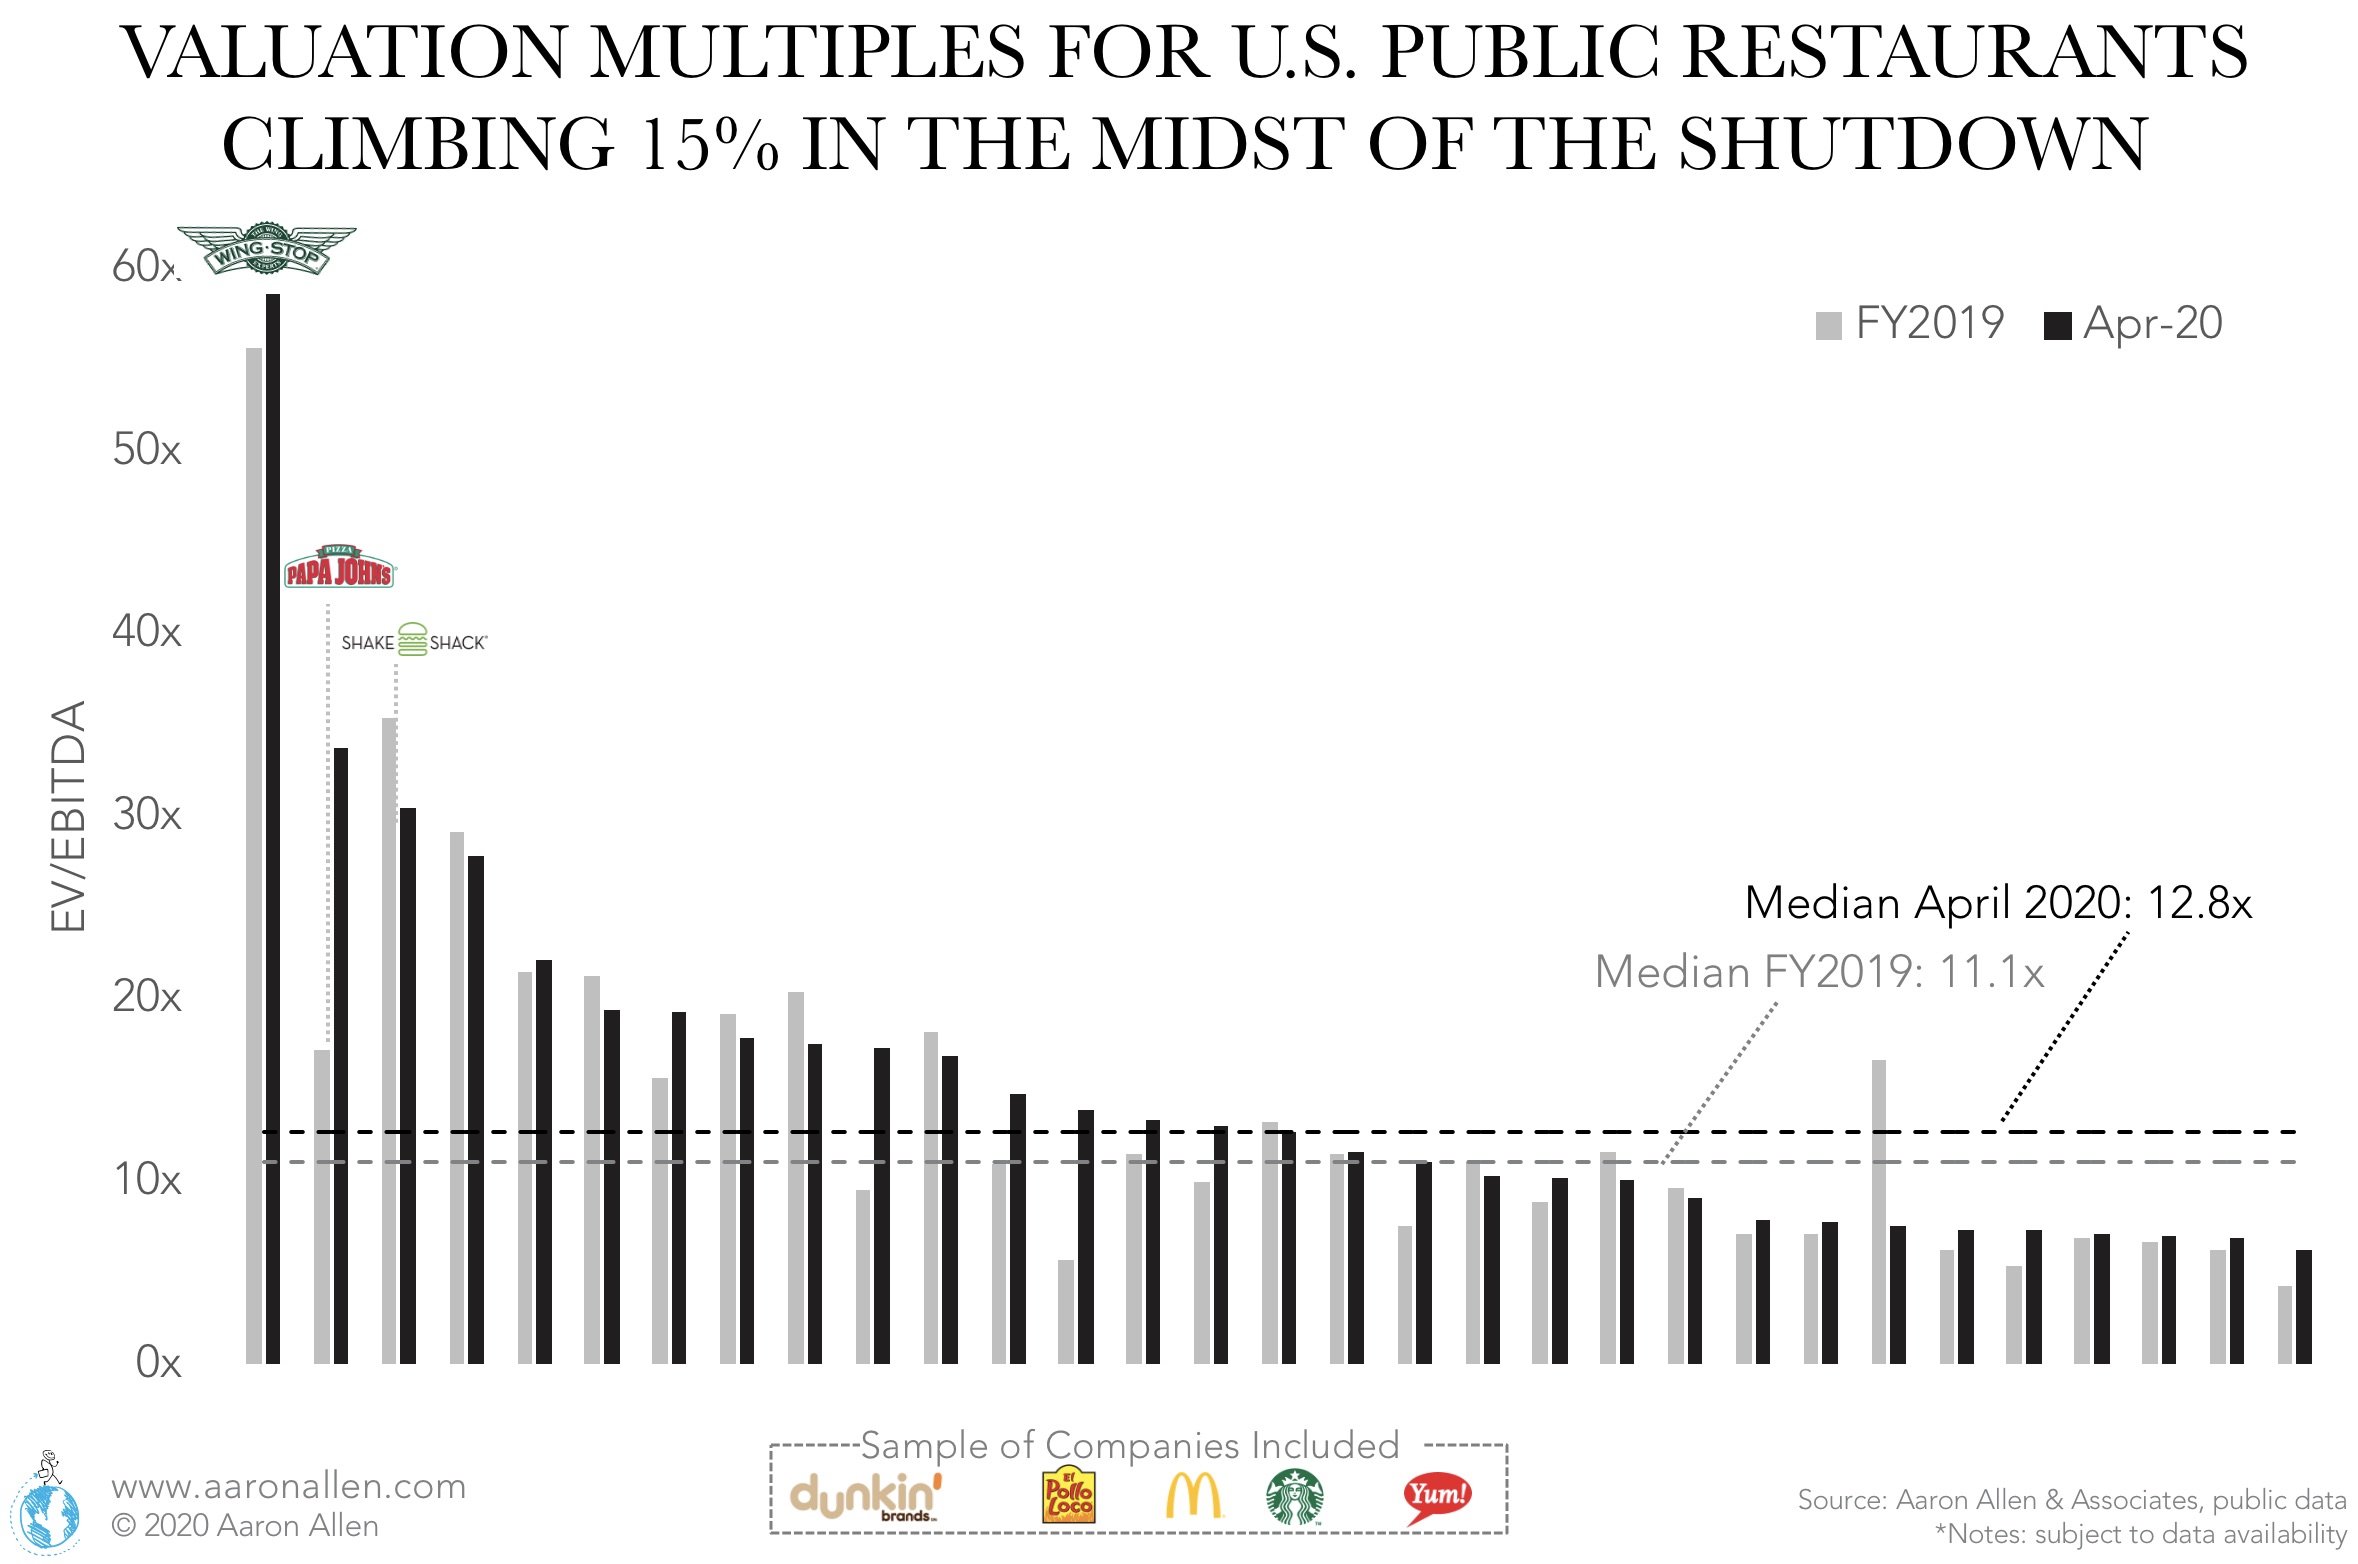
Valuations among U.S. publicly traded companies climbed by 15% even with the economy shutdown and many restaurant chains taking a substantial hit. The median valuation (measured by EV/EBITDA) was 11.1x as of FY 2019 and stands at 12.8x as of April 2020. Wingstop, Papa John’s, Shake Shack, Chipotle, and Domino’s are reaching valuations above 20x. For those sitting on dry powder, this is going to be an extraordinary time to put capital to work by Q3 — finding the right concepts (based on format, location strategy, technology, moat building, etc.) and at the right valuations.